Your has been successfully Logout.
Coronavirus Impact on Global Airlines 2020
Executive Summary: Economic Impact in Brief
Figures and estimates herein are subject to substantial changes, and will be updated
with the situation evolving and more information available.
Estimated results in brief: World total passenger traffic
The latest estimates indicate that the possible COVID-19 impact on world scheduled passenger traffic compared to Baseline (business as usual, originally-planned) would be:
-
Full year 2020 (Jan – Dec)
- Overall reduction of 51% of seats offered by airlines
- Overall reduction of 2,851 million passengers
- Approx. USD 391 billion potential loss of gross passenger operating revenues of airlines
-
Full year 2021 (Jan – Jun)
- Overall reduction of 51% of seats offered by airlines
- Overall reduction of 2,851 million passengers
- Approx. USD 391 billion potential loss of gross passenger operating revenues of airlines
The actual impacts will depend on duration and magnitude of the outbreak and containment measures, the degree of consumer confidence for air travel, and economic conditions, etc.
Estimated results in brief: International and domestic
-
International passenger traffic for 2020 compared to Baseline
- Overall reduction of 67% of seats offered by airlines
- Overall reduction of 1,444 million passengers
- Approx. USD 262 billion potential loss of gross operating revenues of airlines
-
Domestic passenger traffic for 2020 compared to Baseline
- Overall reduction of 40% of seats offered by airlines
- Overall reduction of 1,407 million passengers
- Approx. USD 128 billion potential loss of gross operating revenues of airlines
| Compared to Baseline |
Seat capacity (%) | Passenger number (million) | Passenger revenue (USD, billion) | ||||||
| Total | International | Domestic | Total | International | Domestic | Total | International | Domestic | |
| 1Q 2020 | ‐18% | ‐20% | ‐17% | ‐280 | -108 | ‐172 | ‐35 | ‐20 | ‐15 |
| 2Q 2020 | ‐79% | -92% | ‐69% | ‐1,025 | ‐478 | ‐546 | ‐135 | ‐85 | ‐50 |
| 3Q 2020 | ‐56% | ‐75% | ‐42% | ‐865 | ‐468 | ‐397 | ‐122 | ‐85 | ‐36 |
| 4Q 2020 | ‐49% | ‐75% | ‐31% | ‐681 | ‐389 | ‐292 | ‐99 | ‐72 | ‐27 |
| Total 2020 | ‐51% | ‐67% | ‐40% | ‐2,851 | ‐1,444 | ‐1,407 | ‐391 | ‐262 | ‐128 |
| 1Q 2021 | -48% to ‐50% | -72% to -75% | -32% to 33% | -634 to -673 | -357 to -372 | -277 to -301 | -92 to -97 | -66 to -69 | -26 to -28 |
| 2Q 2021 | -32% to -44% | -49% to -69% | -20% to -28% | -495 to -687 | -307 to -401 | -188 to -286 | -71 to -98 | -54 to -71 | -17 to -27 |
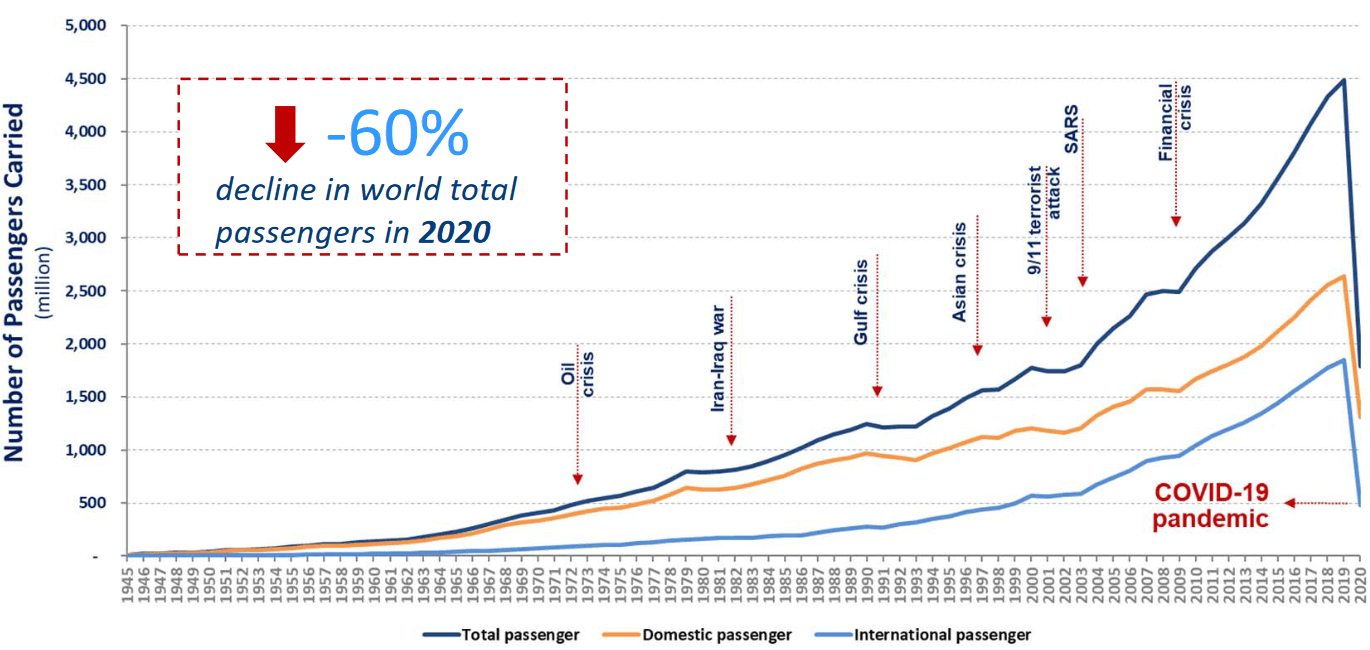
World passenger traffic collapses with unprecedented decline in history
World passenger traffic evolution
1945 –2020
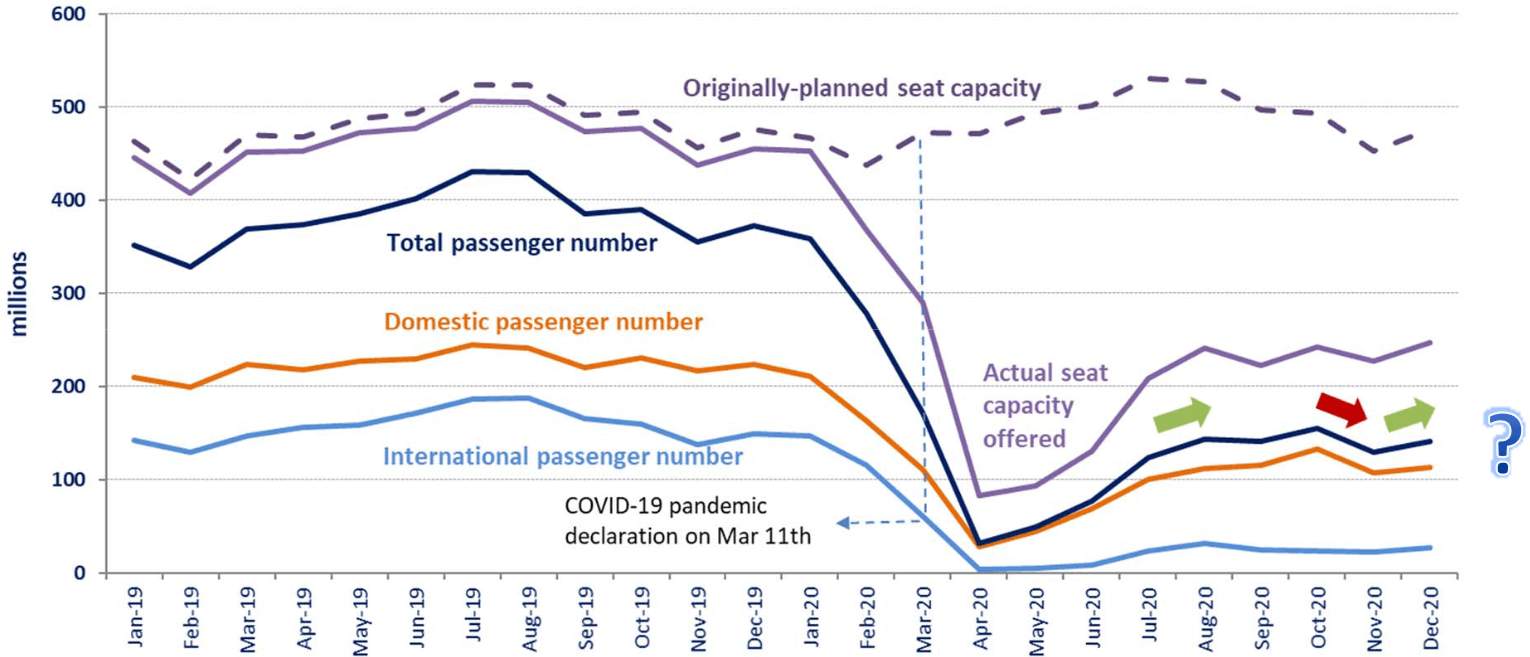
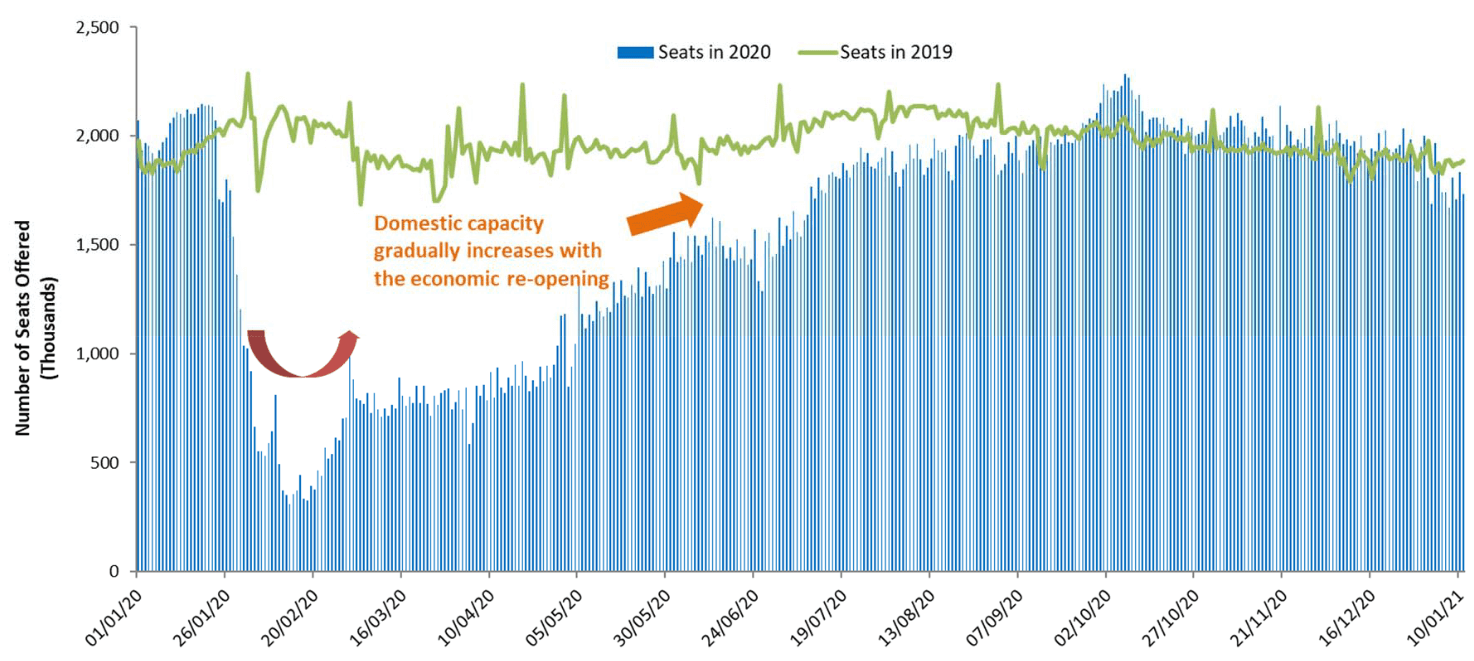
Drastic capacity cut along with dramatic drop in demand
Comparison of passenger numbers and capacity (Slight uptick in domestic travel while international travel remained stagnant)
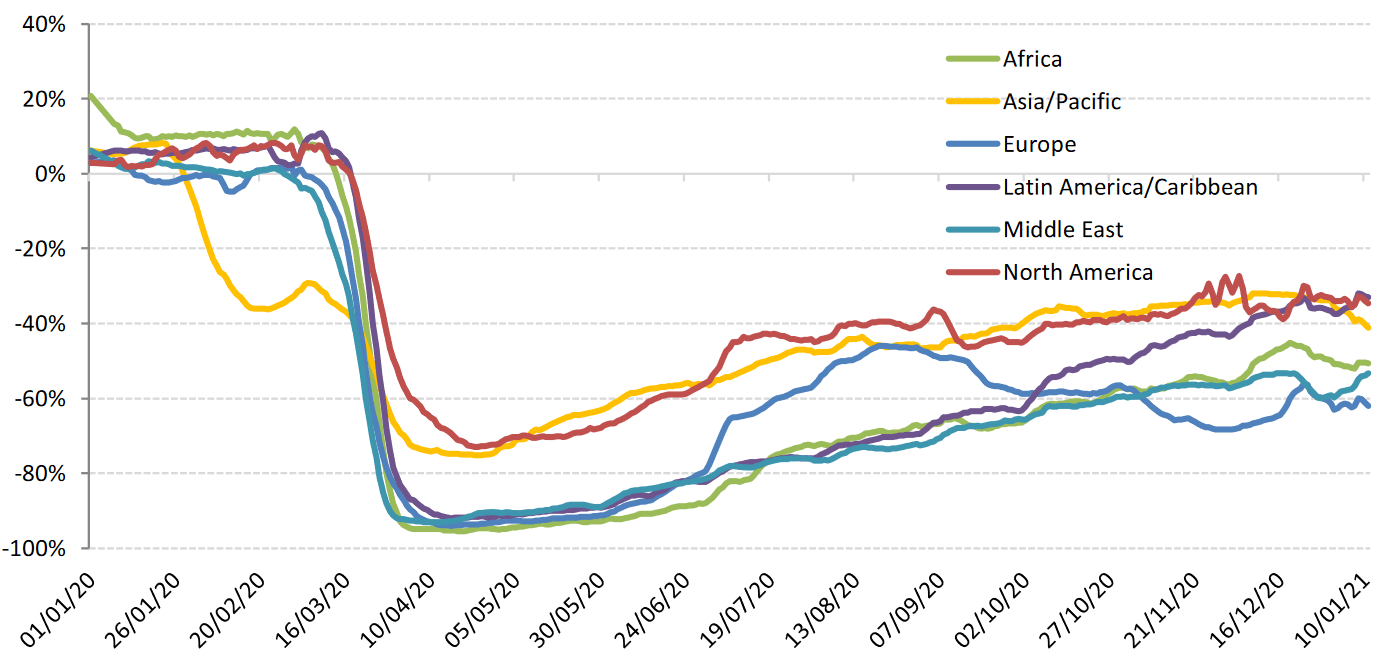
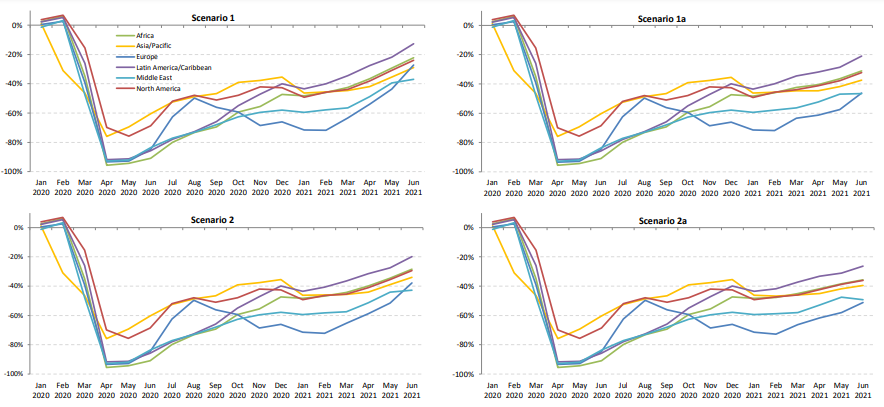
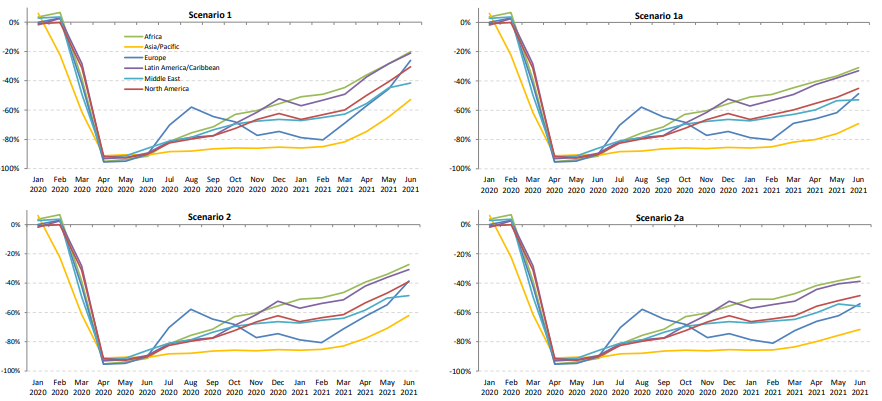
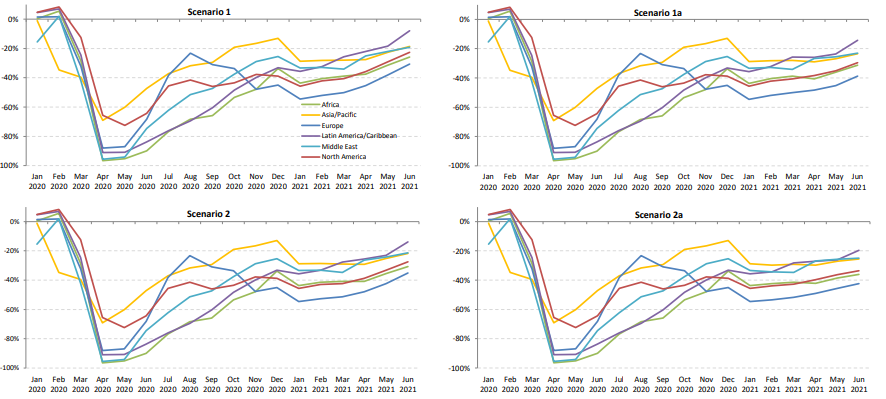
Regional difference in resilience and speed of recovery
Comparison of total seat capacity by region(7‐day average, YoY compared to 2019)
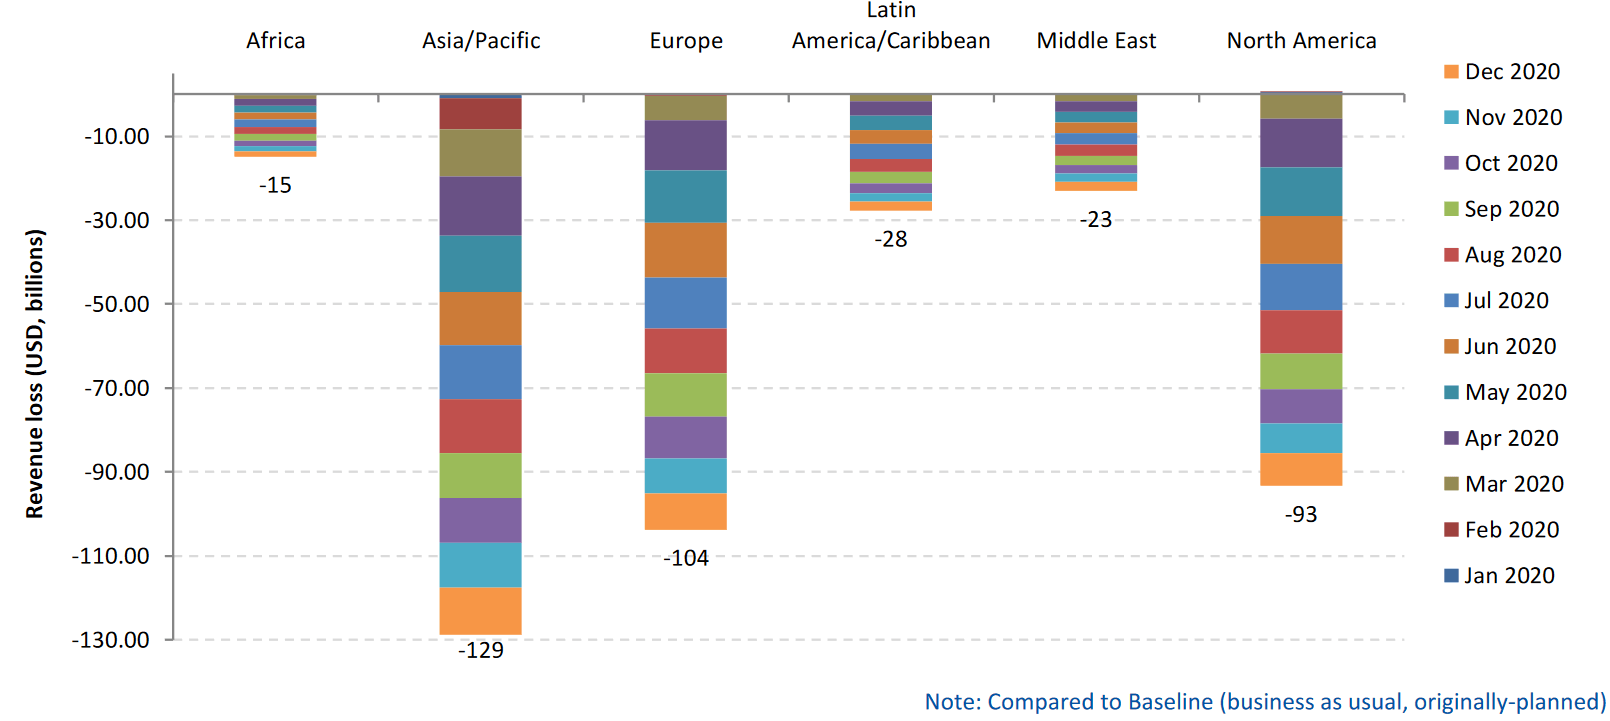
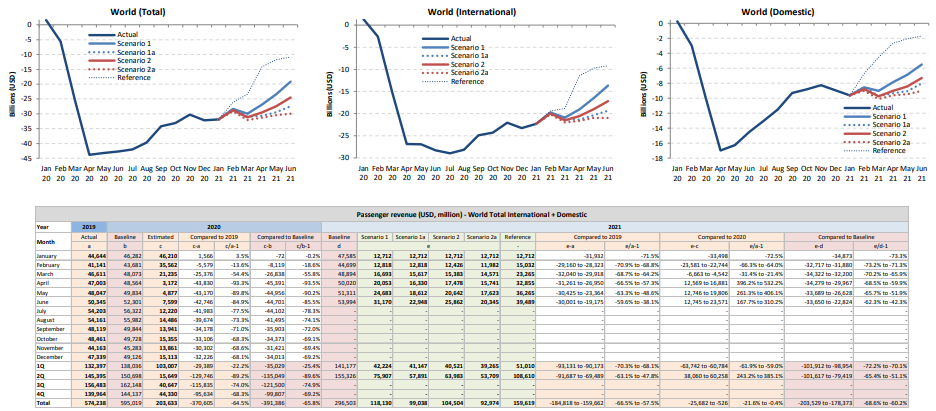
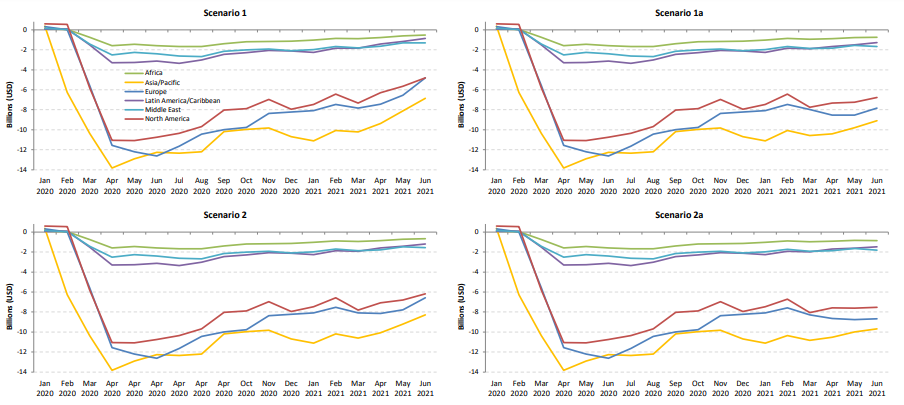
Approximately USD 391 billion passenger revenue loss in 2020
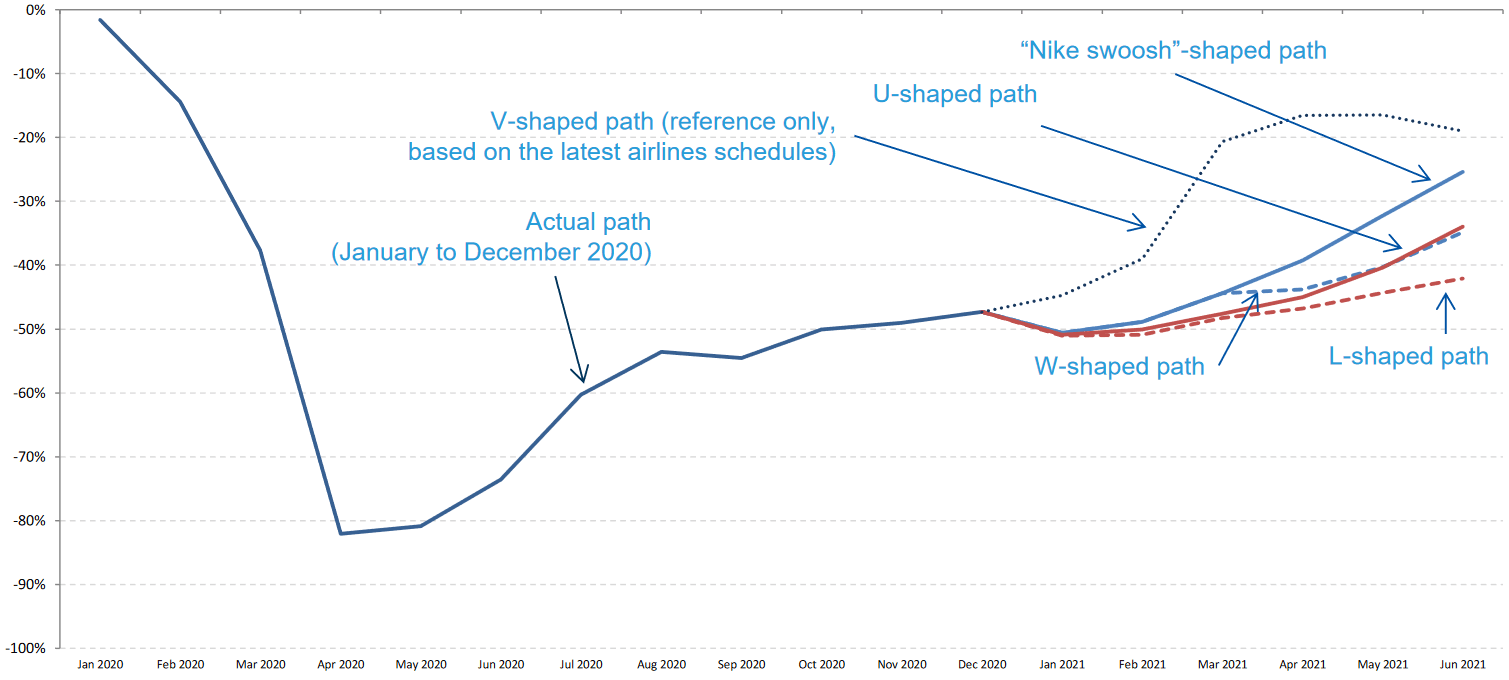
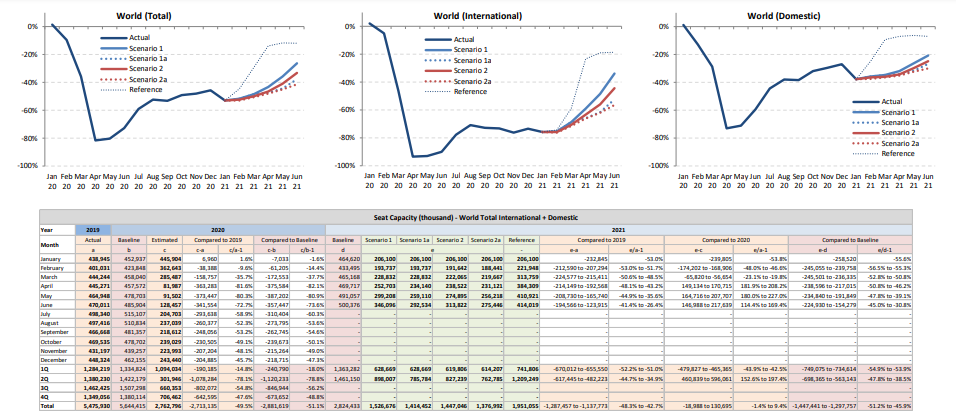
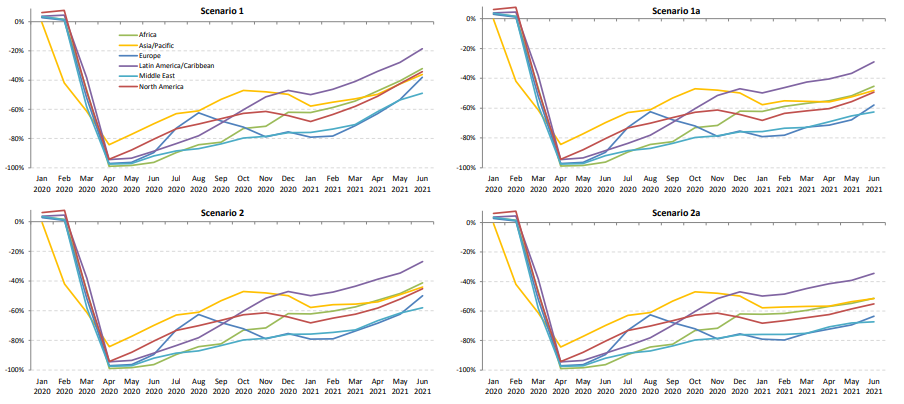
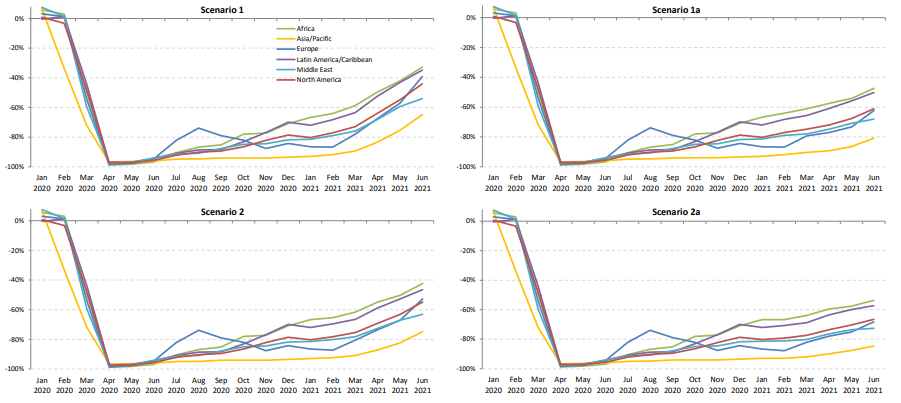
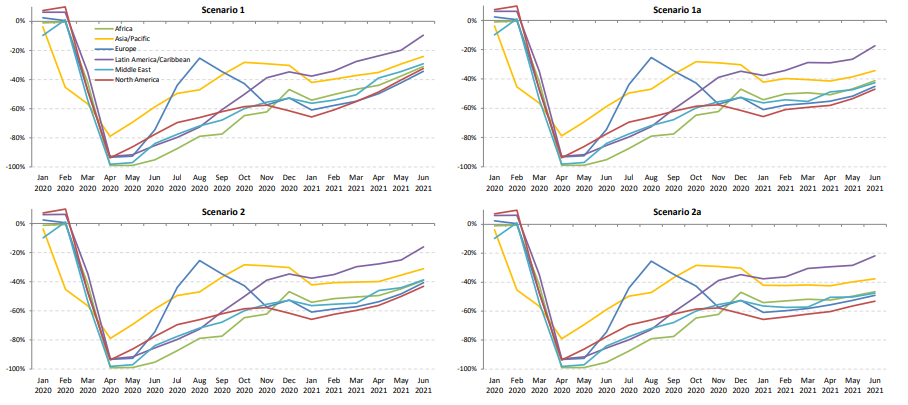
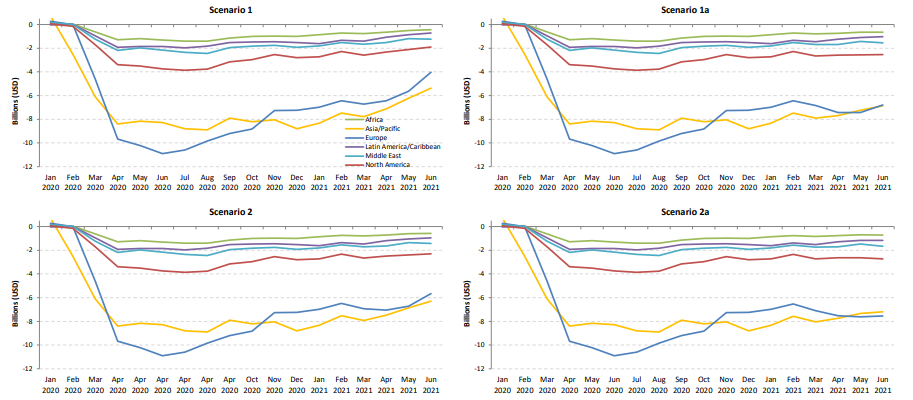
Due to extreme uncertainty, 4 different paths are considered
Scenarios for passenger seat capacity compared to Baseline (business as usual)
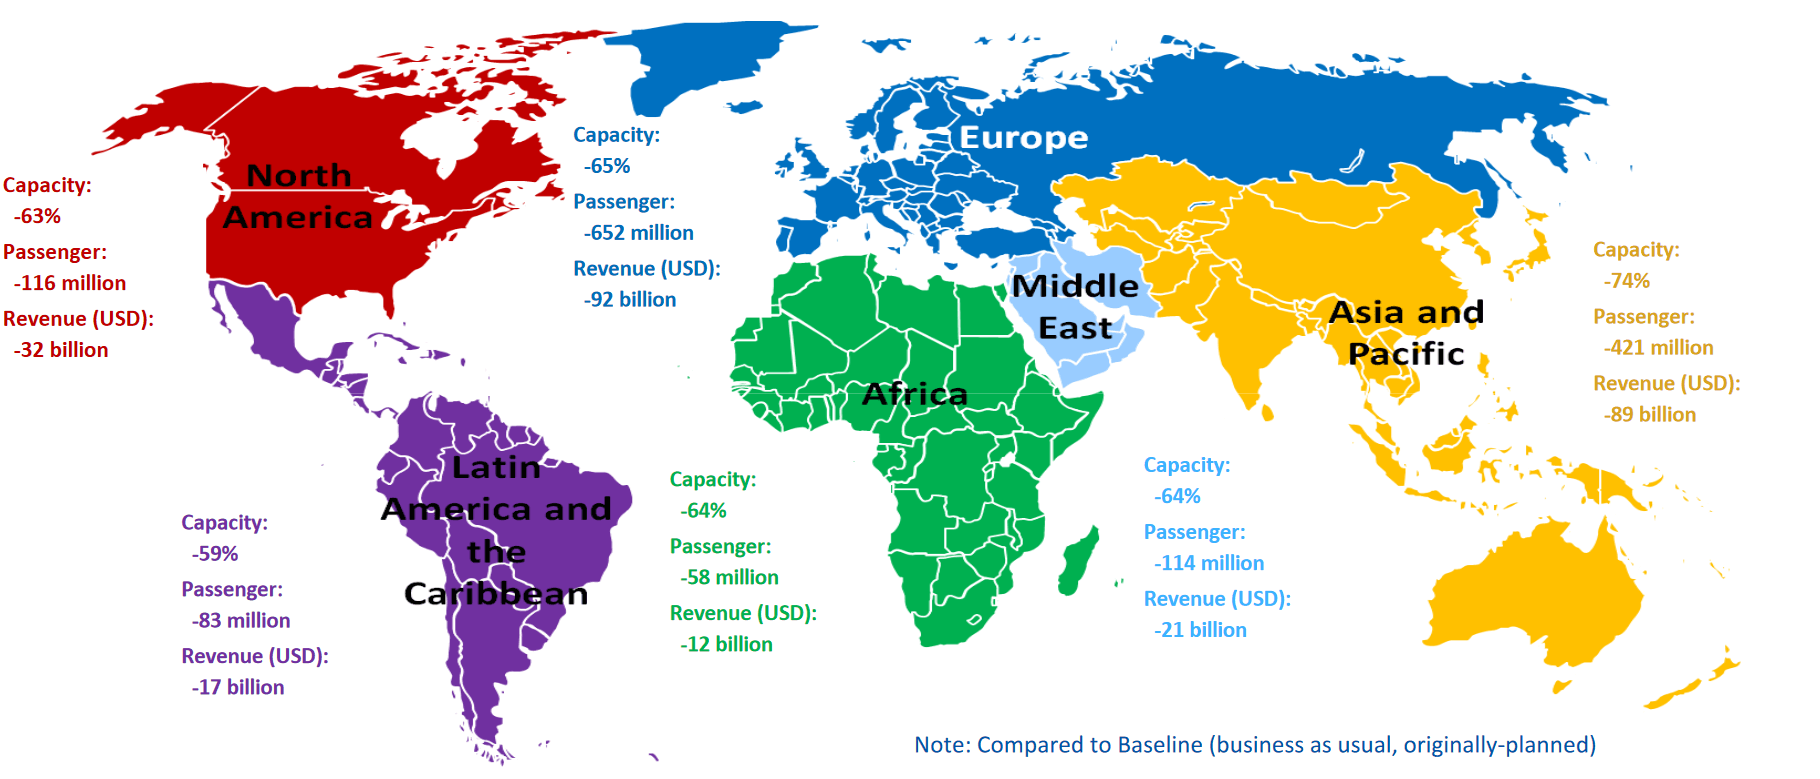
Estimated impact on international passenger traffic and revenues by region for 2020
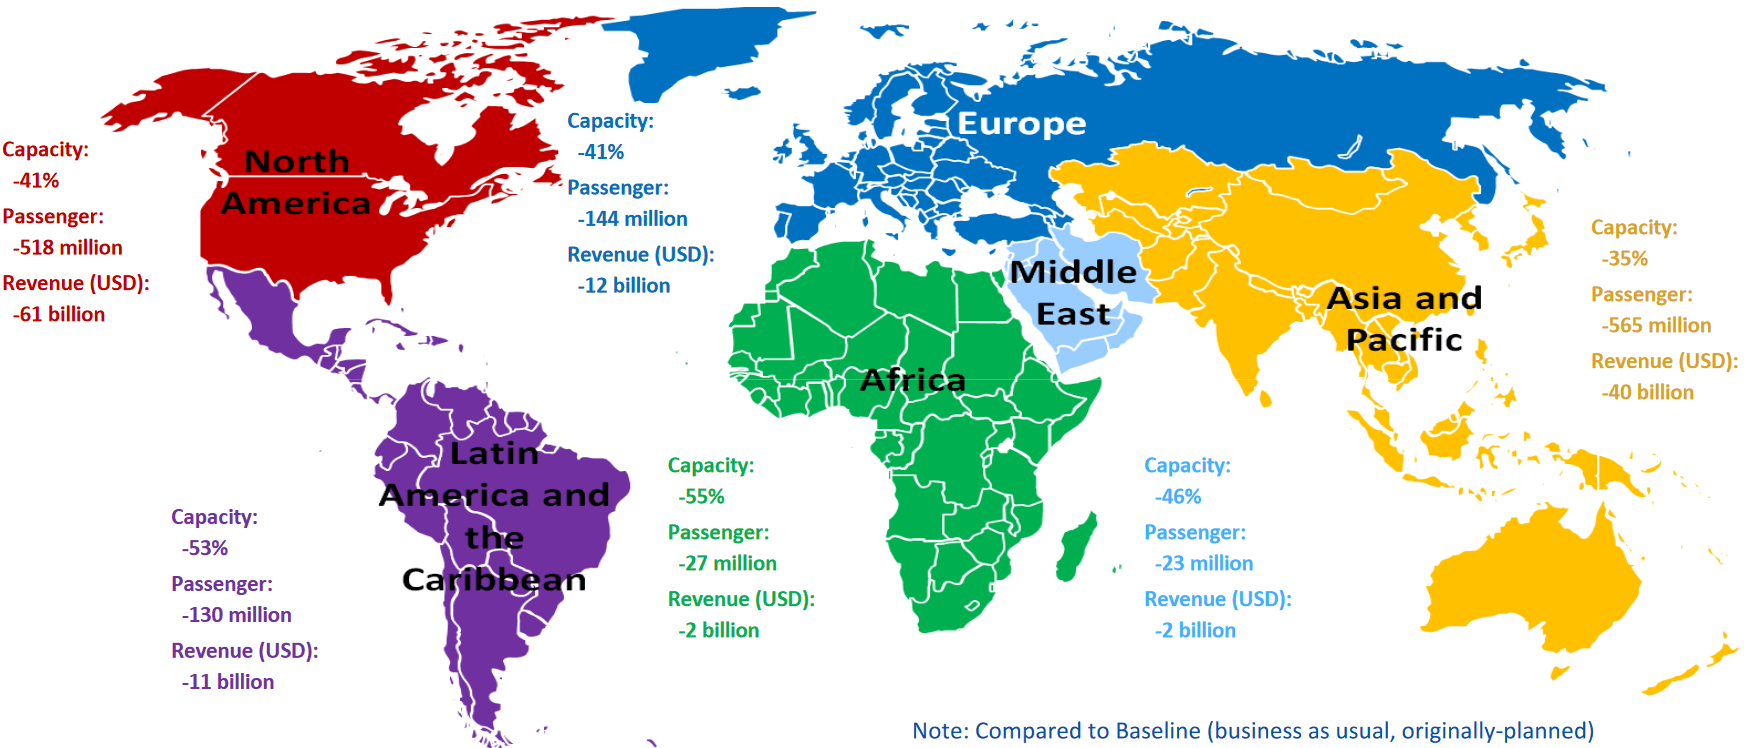
Estimated impact on domestic passenger traffic and revenues by region for 2020
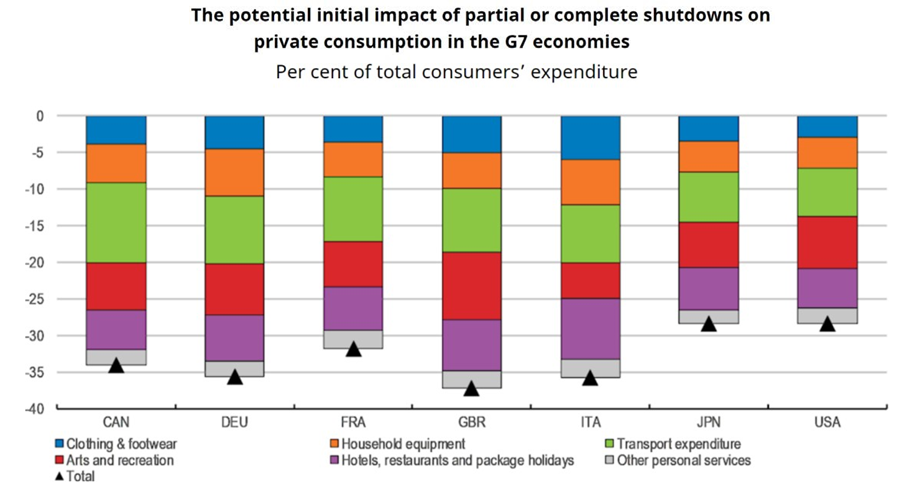
Global impact of COVID‐19 on aviation, tourism, trade and economy in 2020
- Air passenger traffic: An overall reduction of air passengers (both international and domestic) ranging from 60% in 2020 compared to 2019 (by ICAO)
- Airports: An estimated loss of approximately 64.2% of passenger traffic and 65% or over USD 111.8 billion airport revenues in 2020 compared to business as usual (by ACI)
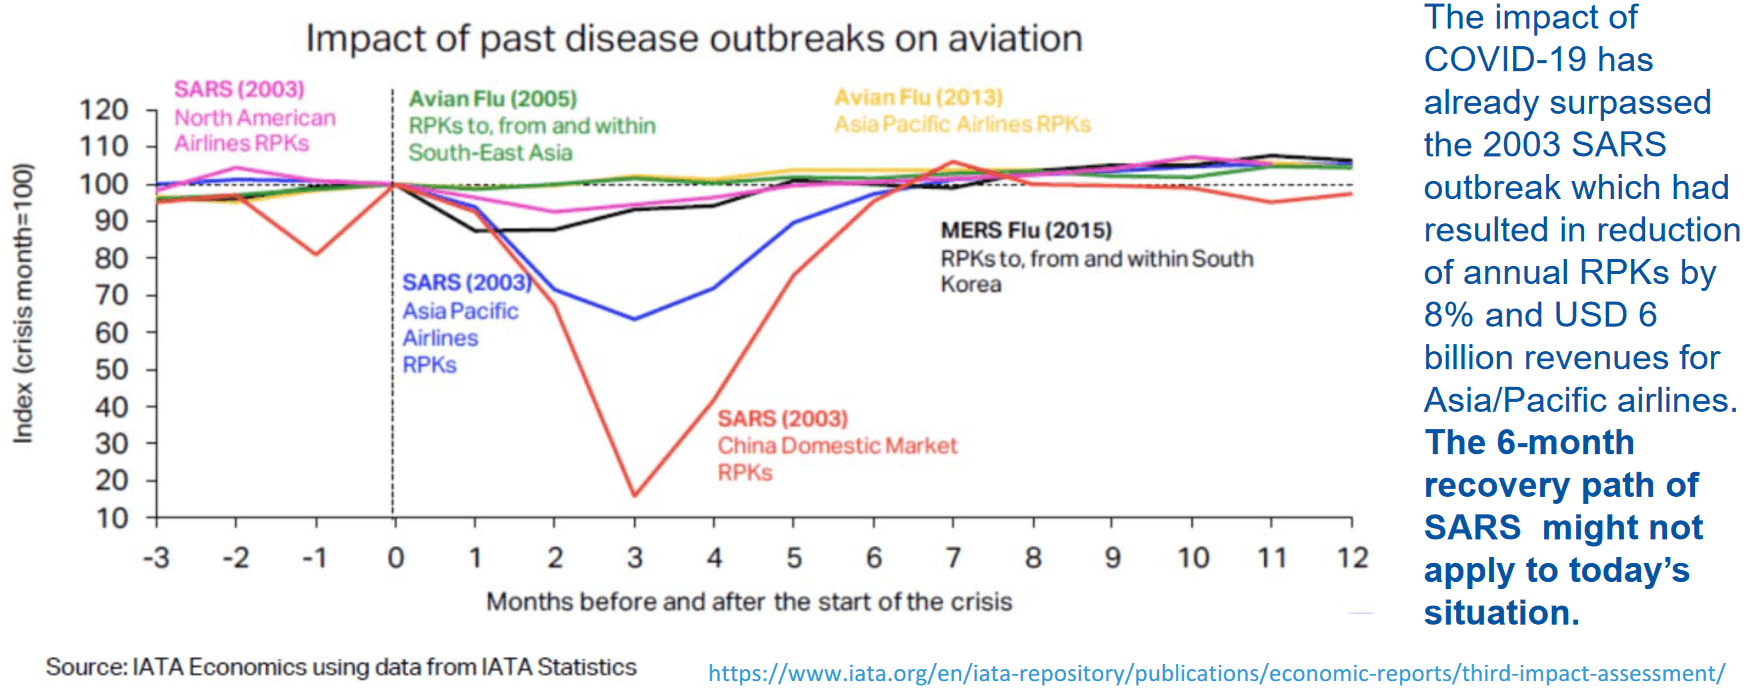
- Airlines: A 66.3% decline of revenue passenger kilometres (RPKs, both international and domestic) in 2020 compared to 2019 (by IATA)
- Tourism: A decline in international tourism receipts of between USD 910 to 1,170 billion in 2020, compared to the USD 1.5 trillion generated in 2019, with 100% of worldwide destinations having travel restrictions (by U NWTO)
- Trade: A fall of global merchandise trade volume by 9.2% in 2020 compared to 2019 (by WTO)
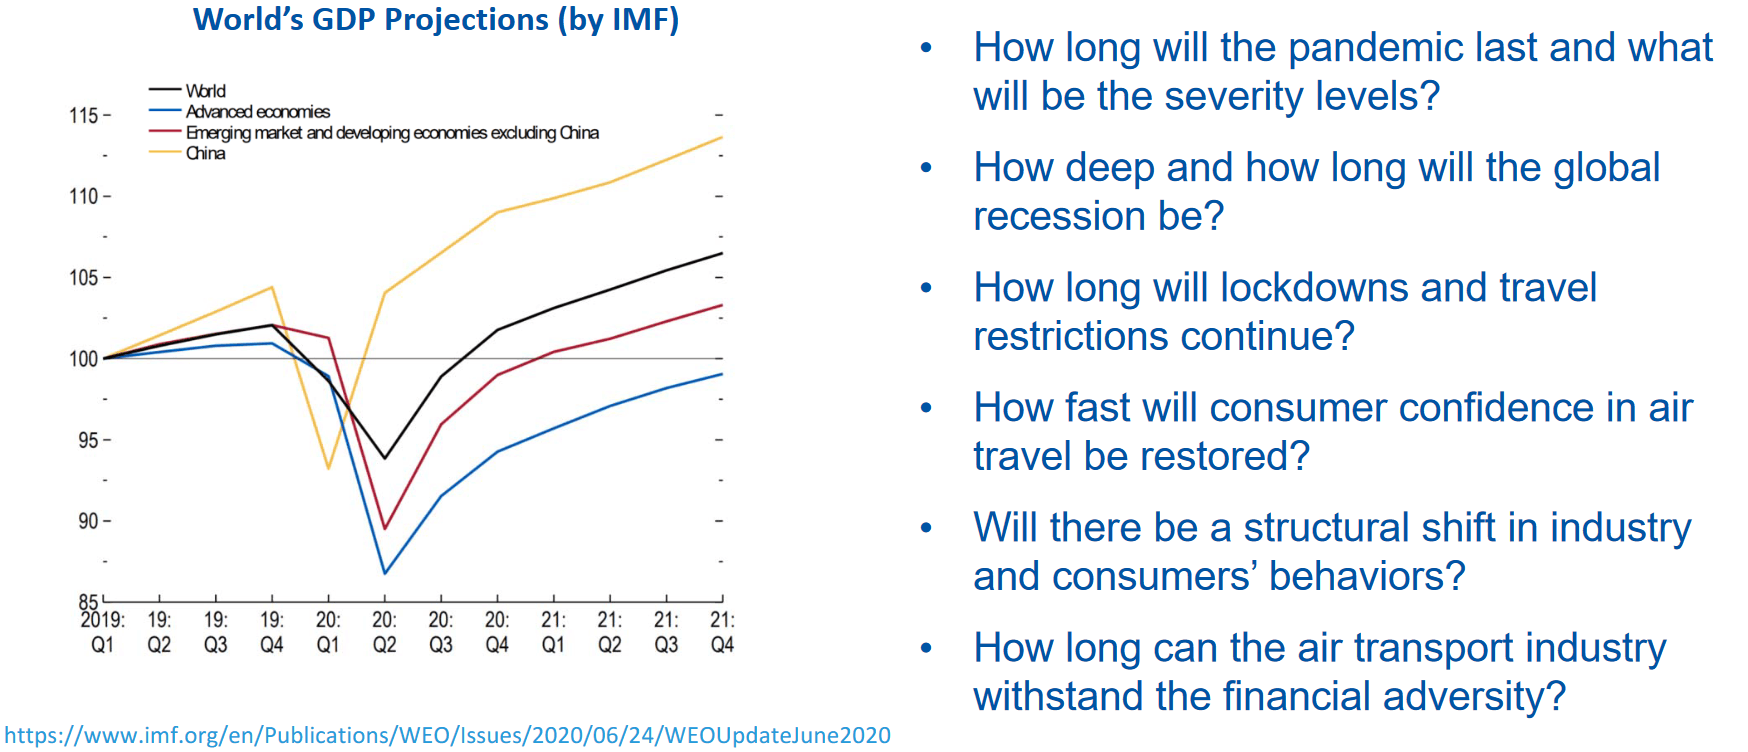
- Global economy: A projected -4.3% to -4.4% contraction in world GDP in 2020, far worse than during the 2008–09 financial crisis (by IMF and World Bank)
Scenario Building
Scope of analysis
-
Analysis focuses on simultaneous supply shock and drop in demand
- - in a near-term, i.e. monthly profile from January 2020 to June 2021
- - in terms of scheduled passenger traffic globally
-
Taking into account the heterogeneity, distinction is made:
- - between international and domestic
- - by month (seasonality)
- - by six (6) geographical region and/or 50 route groups used in ICAO’s long-term traffic forecasts (LTF)
-
Analysis is based on forward-looking scenarios, which will be continuously adjusted and updated
- Geographical disparity of international-domestic passenger traffic mix
- Difference in market size among regions
- Potential difference in resilience and speed of recovery
- Outbreak timing that impacts when traffic would bottom out
- Gap between what is scheduled and actual operations
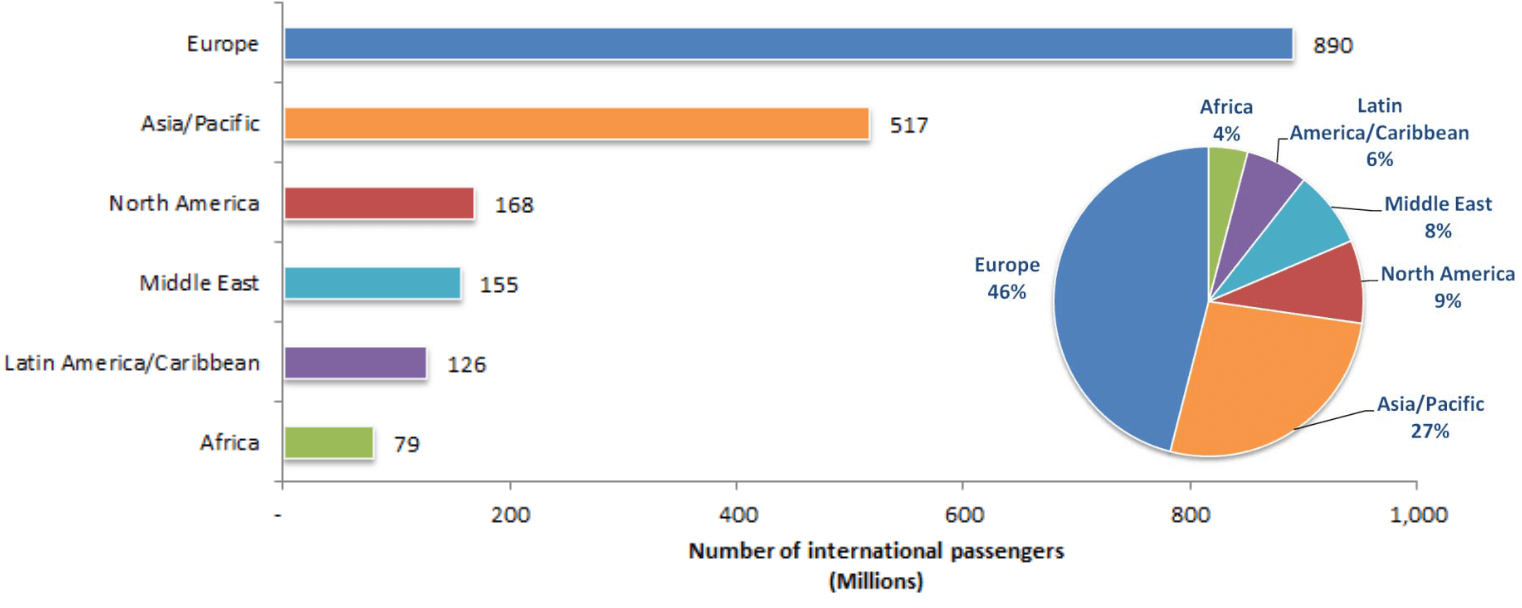
International‐domestic passenger traffic mix exhibits significant geographical disparity
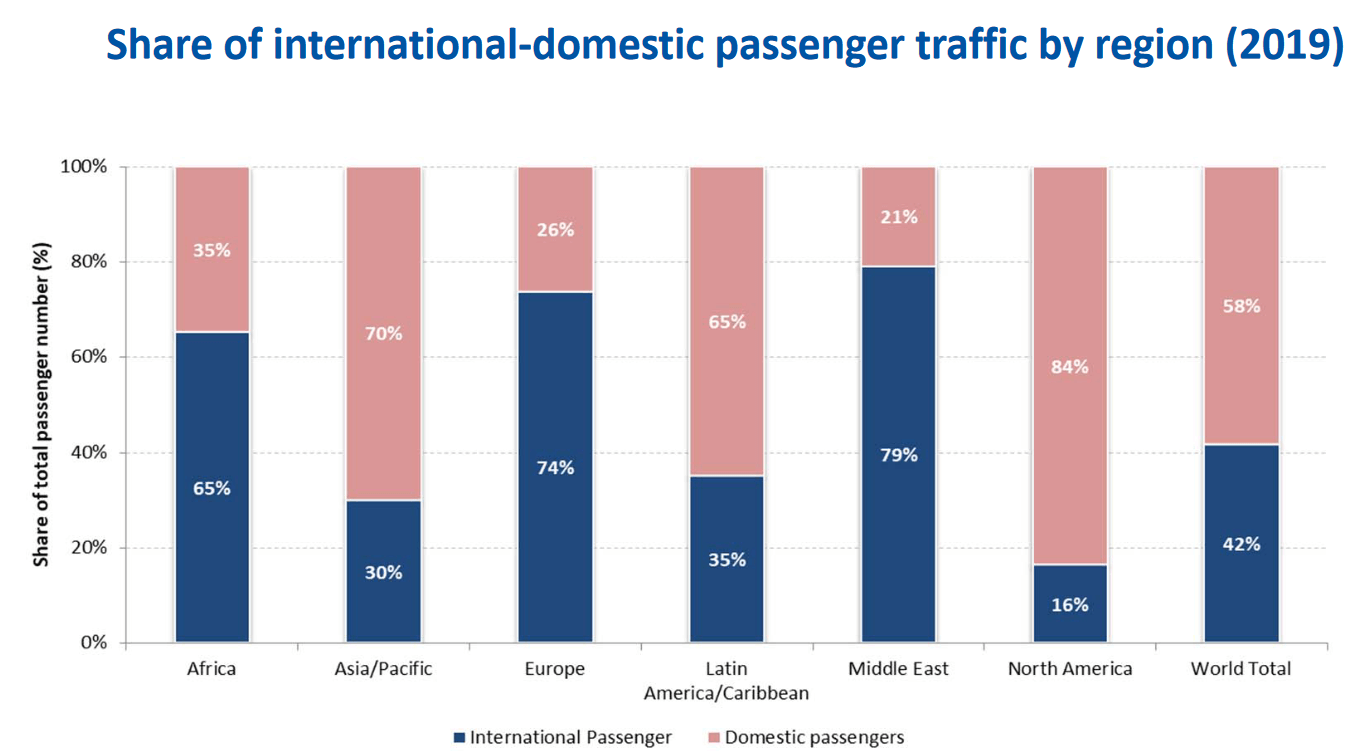
Europe and Asia/Pacific accounted for over 70% of the world international traffic pre‐COVID‐19
Number of International Passengers by Region (2019, based on from/to State)
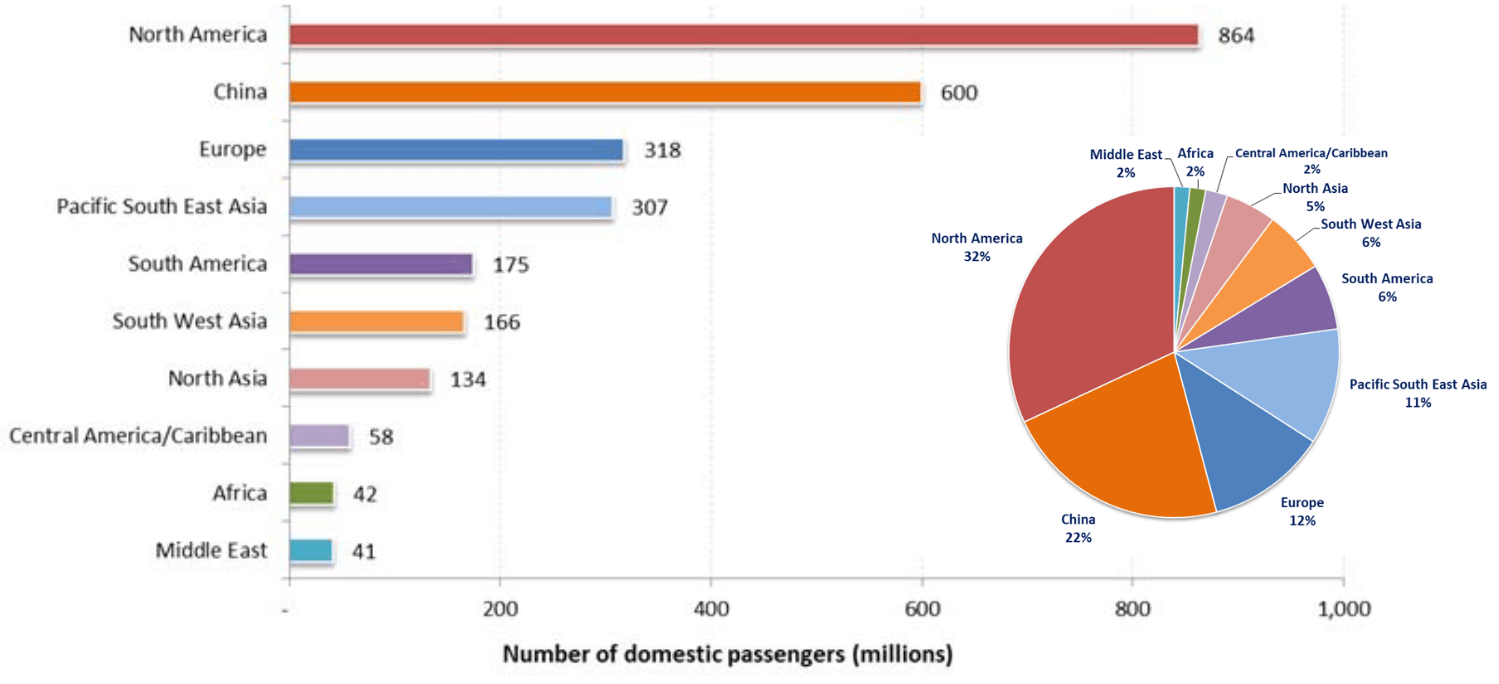
North America and China account for over half of world domestic passenger traffic
Number of Domestic Passengers by Route Group (2019)
Domestic passenger traffic often exhibits more resilience than international
Asia/Pacific and North America have experienced 20% to 25% less decline in domestic passenger traffic than international
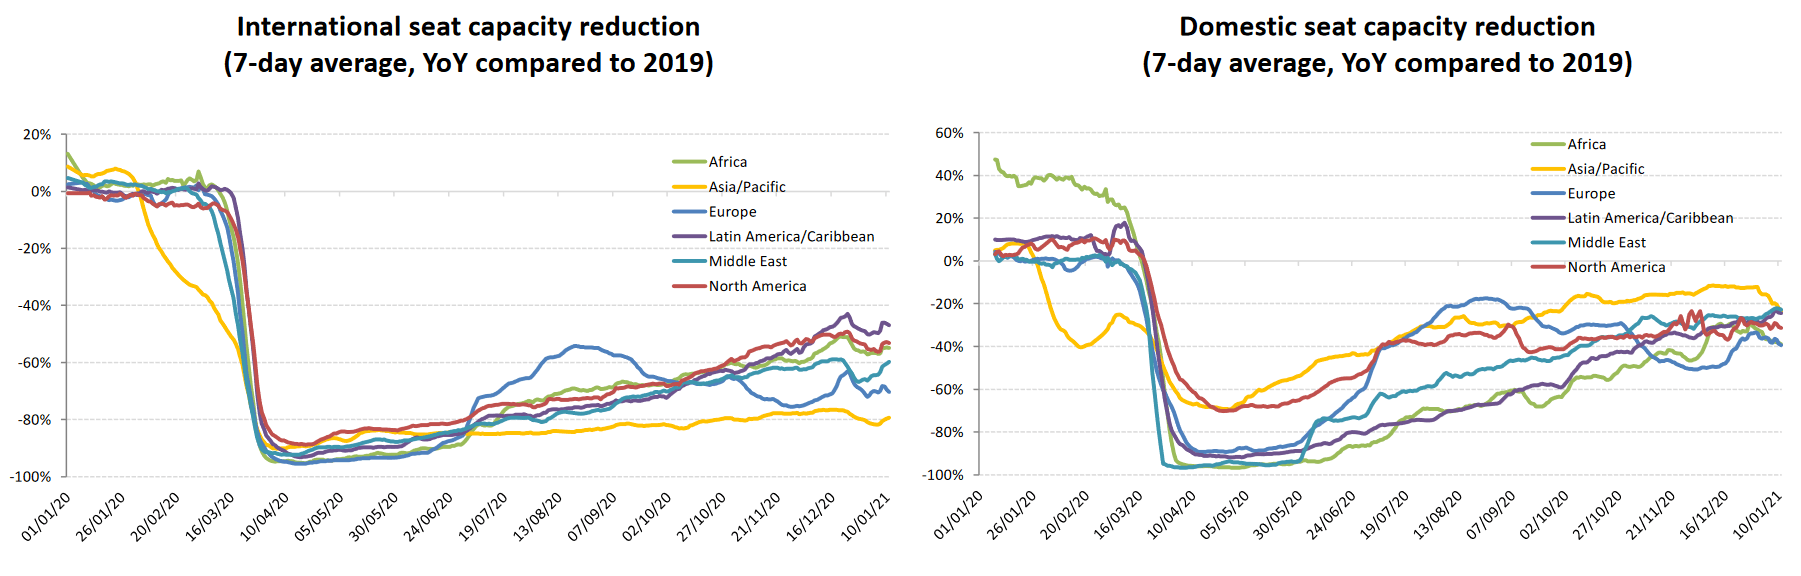
Domestic passenger traffic is recovering ahead of international
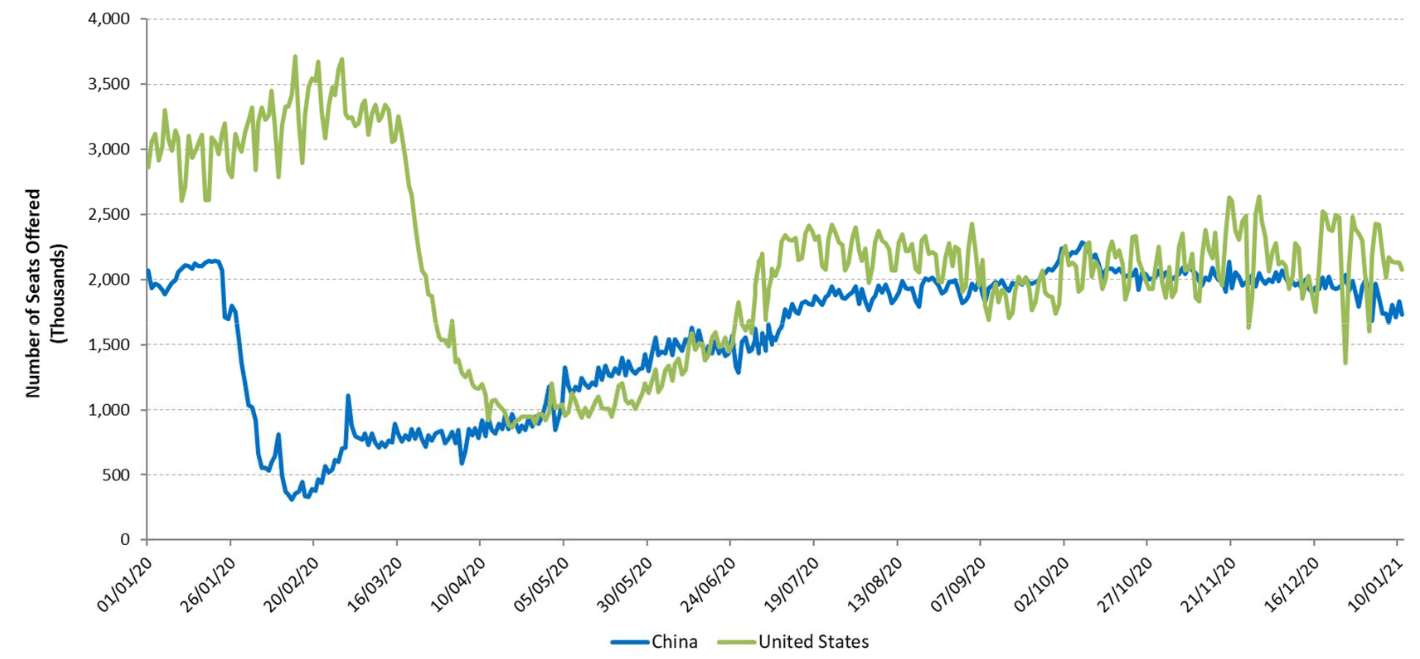
Domestic passenger traffic in China started 2021 with a slower recovery
The outbreak timing impacts when domestic traffic bottoms out in each region
Capacity evolution of two largest domestic markets China and United States since January 2020
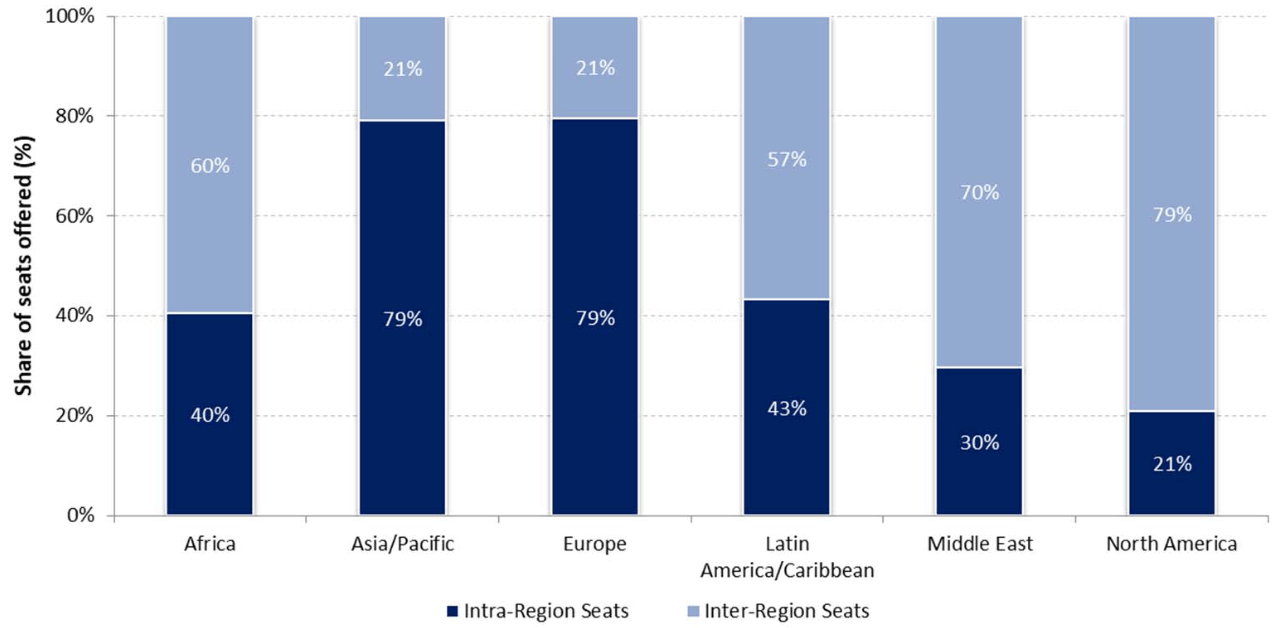
Regions with higher share of intra‐region traffic are expected to recover faster
Almost 80% of international seats offered in Asia/Pacific and Europewere for intra‐regional traffic (2019)
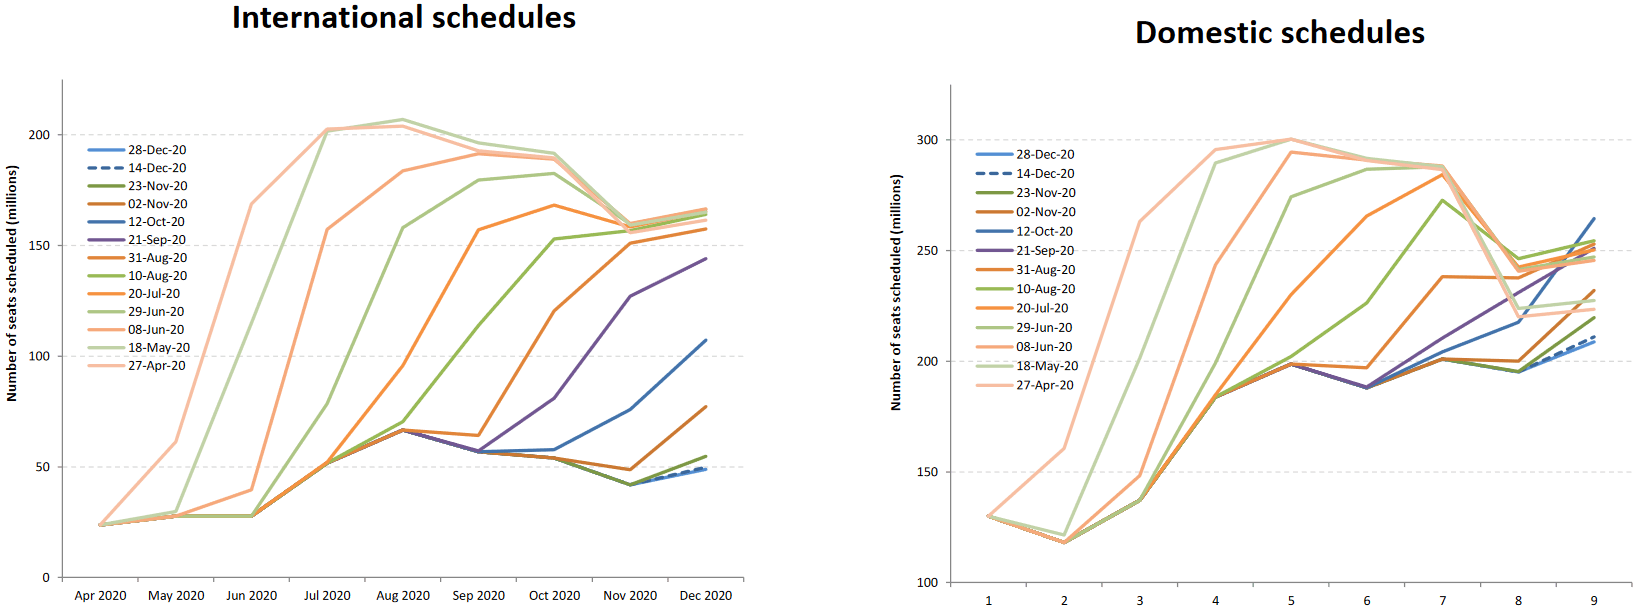
A large gap exists between what is scheduled and actual operations
Airlines announced/planned resumption of flights, however, over half of which were subsequently withdrawn
Informal classification to describe different types of recessions:
- V-shaped: normal shape for recession, a brief period of sharp economic decline followed by quick/smooth recovery
- U-shaped:prolonged contraction and muted recovery to trend line growth
- L-shaped (depression): long-term downturn in economic activity, steep drop followed by a flat line with possibility of not returning to trend line growth
- W-shaped: a double-dip recession, “down up down up” pattern before full recovery
- “Nike swoosh”-shaped*: bounce back sharply but blunt quickly (* Brookings Institution/WEF)
What “recession shape” can be assumedgiven uncertainties surrounding the outlook?
Previous outbreaks/pandemics had a V‐shaped impact on air transport in Asia/Pacific
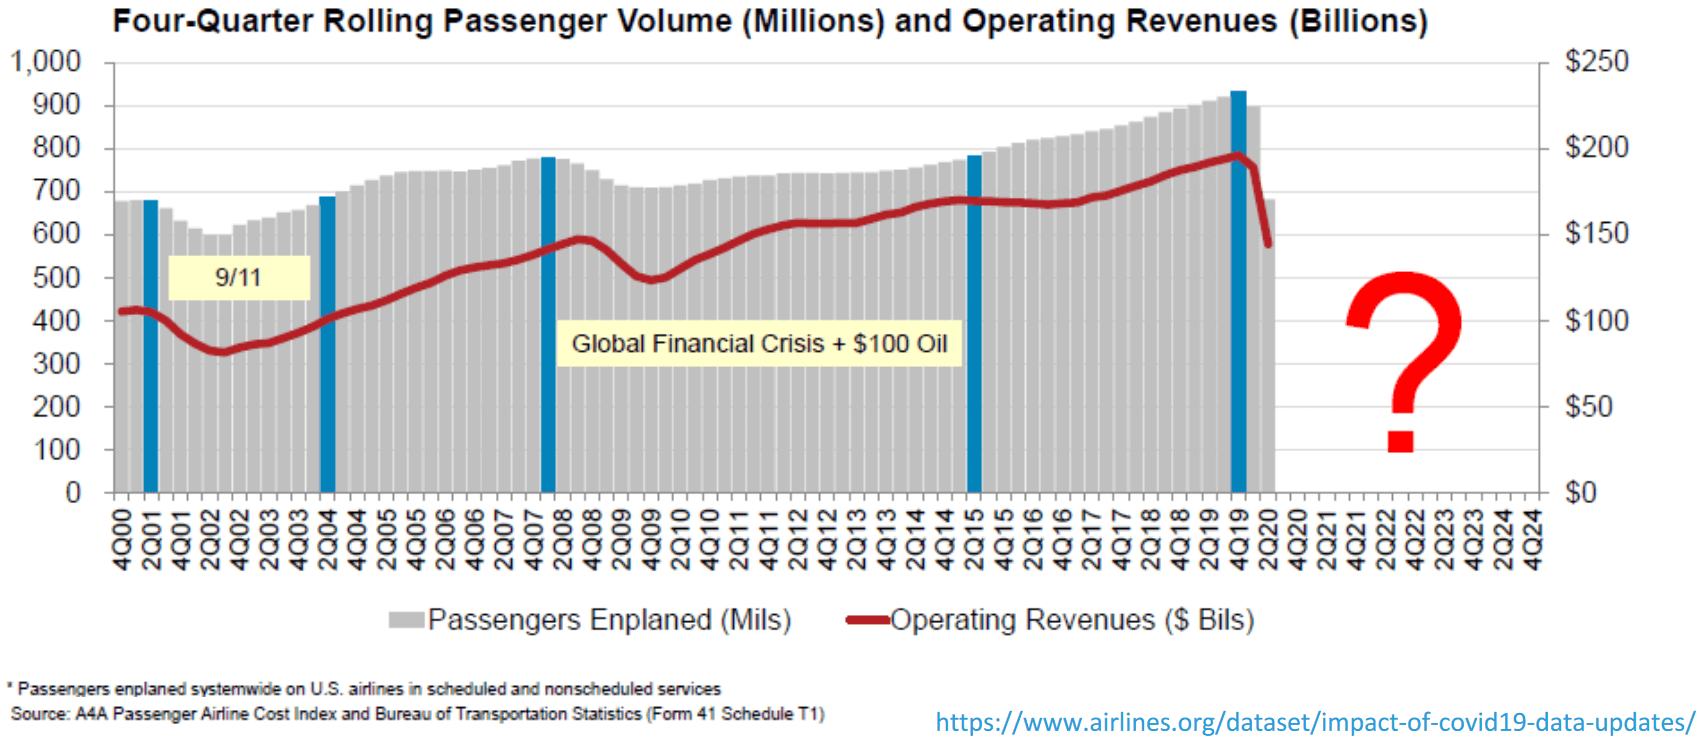
9/11 and global financial crisis had a U/L‐shaped impact on air transport in United States
As overall severity and duration of the COVID-19 pandemic are still uncertain, four (4) different recovery paths under two (2) indicative scenarios are developed:
- Baseline: counterfactual scenario, in which the COVID-19 pandemic does not occur, that is, originally-planned or business as usual
- Scenario 1: two (2) different paths (similar to Nike swoosh- and W-shaped)
- Scenario 2: two (2) different paths (similar to U- and L-shaped)
- Reference: information only, based on latest airline schedules (similar to V-shaped)
What does Scenario mean?
- Notwithstanding the elevated uncertainty surrounding the outlook, a scenario analysis could help gauge potential economic implications of the pandemic
- Scenarios are not forecasts of what is most likely to happen. Given rapidly changing circumstances, they are merely indicative of possible paths or consequential outcomes out of many
- The exact path (depth, length and shape) will depend upon various factors, inter alia, duration and magnitude of the outbreak and containment measures, availability of government assistance, consumer confidence, and economic conditions
- With the situation evolving and more information available, scenarios will be adjusted as necessary
Key assumptions
- International and domestic passenger traffic has separate scenarios/paths
- Scenarios/paths are differentiated in terms of supply and demand, i.e.
- - Scale of output or seat capacity change
- - Degree of consumer confidence that can be translated into demand or load factor as a proxy
- Supply and demand are influenced by:
- - Different timing and speed of recovery by region, international/domestic, and intra-/inter-region
- - Global economic contraction
- No consideration is made to social distancing requirements on aircraft, etc.
- Detailed scenario assumptions are summarized in Appendix B
Baseline & Reference
-
Baseline: originally-planned or business as usual
- - Counterfactual hypothesis that are expected to occur in the absence of COVID-19 pandemic
- - Supply: airlines’ originally-planned schedules supplemented by trend line growth
- - Demand: trend line growth of demand from 2019 (pre-COVID-19) level
-
Reference: V-shaped
- - Information-only scenario that reflects airlines’ most recent expectation or a “signal” of airlines’ plan to the market (not necessarily realistic)
- - Supply: based on latest update of airline schedules filed, which are adjusted weekly by airlines according to the expectation of the evolving situation (quite often managing capacity for a short period due to the uncertainties)
- - Demand: quickly returning to Baseline level
Scenario 1: Nike swoosh- and W-shaped
-
International
- - Path 1: Smooth capacity recovery by picking up pent-up demand but at a diminishing rate of growth
- - Path 1a: Capacity to start with smooth recovery but then turn back down due to over-capacity
-
Domestic
- - Path 1: Swift capacity rebound pushed by pent-up demand but at a diminishing rate of growth
- - Path 1a: Capacity to start with smooth recovery but then turn back down due to over-capacity
Scenario 2: U- and L-shaped
-
International
- - Path 2: Accelerating the return to trend growth after slow progression of capacity recovery
- - Path 2a: Capacity recovery at diminishing speed due to respite and continuous demand slump
-
Domestic
- - Path 2: Gradual capacity recovery, followed by the acceleration of growth
- - Path 2a: Capacity recovery at diminishing speed due to sluggish demand growth
In the following analysis, international and domestic scenarios having the same path number are linked with each other, although different combination of scenarios/paths would be possible
Estimated 2020 Results and Near‐term Outlook: Global
Figures and estimates herein reflect the latest operational data and schedules filed by airlines but are subject to substantial changes, and will be updated with the situation evolving and more information available.
Three (3) key impact indictors
-
Three (3) key impact indicators under four (4) paths of two (2) scenarios:
- - Change of passenger seat capacity (supply, %)
- - Change of passenger numbers (demand)
- - Change of gross passenger operating revenues of airlines
-
Comparison to:
- - Baseline scenario
- - 2019 level
- - 2020 level (for 2021 estimates)
-
Break-down by:
- - International and domestic
- - Month, quarter and year
Estimated impacts compared to 2019 & Baseline
| Compared to 2019 | Seat capacity (%) | Passenger number (thousand) | Passenger revenue (USD, million) | |||||||||
| Total | International | Domestic | Total | International | Domestic | Total | International | Domestic | ||||
| 1Q 2020 | ‐14.8% | ‐16.9% | ‐13.4% | ‐233,912 | ‐22.7% | ‐89,922 | ‐22.0% | ‐143,990 | ‐23.2% | ‐29,389 | ‐16,538 | ‐12,852 |
| 2Q 2020 | ‐78.1% | ‐92.1% | ‐67.8% | ‐984,443 | ‐86.4% | ‐460,226 | ‐96.6% | ‐524,217 | ‐79.1% | ‐129,746 | ‐81,993 | ‐47,753 |
| 3Q 2020 | ‐54.8% | ‐73.9% | ‐40.2% | ‐821,251 | ‐67.2% | ‐449,405 | ‐85.2% | ‐371,846 | ‐53.5% | ‐115,835 | ‐82,002 | ‐33,833 |
| 4Q 2020 | ‐47.6% | ‐74.3% | ‐29.4% | ‐658,998 | ‐60.2% | ‐376,110 | ‐86.0% | ‐282,888 | ‐43.0% | ‐95,634 | ‐69,608 | ‐26,026 |
| Total 2020 | ‐49.5% | ‐65.7% | ‐37.9% | ‐2,699 | ‐60.2% | ‐1,375,663 | ‐74.4% | ‐1,322,940 | ‐50.2% | ‐370,605 | ‐250,141 | ‐120,464 |
| 1Q 2021 | ‐52.2% to ‐51.0% | ‐74.4% to ‐73.2% | ‐37.1% to ‐36.1% | ‐659,379 to ‐635,811 | ‐64.0% to ‐61.8% | ‐345,699 to ‐338,314 | ‐84.6% to ‐82.8% | ‐313,680 to ‐297,497 | ‐50.5% to ‐47.9% | ‐93,131 to ‐90,173 | ‐64,380 to ‐62,972 | ‐28,751 to ‐27,202 |
| 2Q 2021 | ‐44.7% to ‐34.9% | ‐61.4% to ‐46.7% | ‐32.4% to ‐26.2% | ‐664,425 to ‐502,413 | ‐58.3% to ‐44.1% | ‐358,819 to ‐278,581 | ‐75.3% to ‐58.5% | ‐305,607 to ‐223,832 | ‐46.1% to ‐33.8% | ‐91,687 to ‐69,489 | ‐63,581 to ‐49,273 | ‐28,106 to ‐20,216 |
| 3Q 2021 | ‐ | ‐ | ‐ | ‐ | ‐ | ‐ | ‐ | ‐ | ‐ | ‐ | ‐ | ‐ |
| 4Q 2021 | ‐ | ‐ | ‐ | ‐ | ‐ | ‐ | ‐ | ‐ | ‐ | ‐ | ‐ | ‐ |
| Total 1Q/2Q 2021 | ‐48.3% to ‐42.7% | ‐67.5% to ‐59.1% | ‐34.7% to ‐31.1% | ‐1,323,805 to ‐1,138,224 | ‐61.0% to ‐52.5% | ‐704,518 to ‐616,895 | ‐79.6% to ‐69.7% | ‐619,287 to ‐521,329 | ‐48.2% to ‐40.6% | ‐184,818 to ‐159,662 | ‐127,961 to ‐112,244 | ‐56,857 to ‐47,418 |
| Compared to Baseline | Seat capacity (%) | Passenger number (thousand) | Passenger revenue (USD, million) | |||||||||
| Total | International | Domestic | Total | International | Domestic | Total | International | Domestic | ||||
| 1Q 2020 | ‐18.0% | ‐20.0% | ‐16.7% | ‐279,917 | ‐26.0% | ‐108,095 | ‐25.3% | ‐171,821 | ‐26.5% | ‐35,029 | ‐19,759 | ‐15,269 |
| 2Q 2020 | ‐78.8% | ‐92.4% | ‐68.7% | ‐1,024,747 | ‐86.9% | ‐478,427 | ‐96.8% | ‐546,320 | ‐79.8% | ‐135,049 | ‐85,225 | ‐49,824 |
| 3Q 2020 | ‐56.2% | ‐74.6% | ‐42.1% | ‐865,024 | ‐68.3% | ‐468,004 | ‐85.7% | ‐397,020 | ‐55.2% | ‐121,500 | ‐85,312 | ‐36,188 |
| 4Q 2020 | ‐48.8% | ‐74.9% | ‐30.9% | ‐689,731 | ‐61.2% | ‐388,876 | ‐86.3% | ‐300,856 | ‐44.5% | ‐99,807 | ‐72,094 | ‐27,713 |
| Total 2020 | ‐51.1% | ‐66.8% | ‐39.7% | ‐2,859,419 | ‐61.5% | ‐1,443,402 | ‐75.3% | ‐1,416,017 | ‐51.9% | ‐391,386 | ‐262,390 | ‐128,996 |
| 1Q 2021 | ‐54.9% to ‐53.9% | ‐75.8% to ‐74.7% | ‐40.9% to ‐39.8% | ‐730,798 to ‐707,230 | ‐66.4% to ‐64.2% | ‐371,544 to ‐364,159 | ‐85.5% to ‐83.8% | ‐359,254 to ‐343,071 | ‐53.9% to ‐51.5% | ‐101,912 to ‐98,954 | ‐69,014 to ‐67,606 | ‐32,898 to ‐31,348 |
| 2Q 2021 | ‐47.8% to ‐38.5% | ‐63.8% to ‐50.0% | ‐35.8% to ‐29.9% | ‐738,645 to ‐576,633 | ‐60.9% to ‐47.5% | ‐391,564 to ‐311,326 | ‐76.9% to ‐61.2% | ‐347,081 to ‐265,307 | ‐49.3% to ‐37.7% | ‐101,617 to ‐79,419 | ‐69,621 to ‐55,313 | ‐31,997 to ‐24,107 |
| 3Q 2021 | ‐ | ‐ | ‐ | ‐ | ‐ | ‐ | ‐ | ‐ | ‐ | ‐ | ‐ | ‐ |
| 4Q 2021 | ‐ | ‐ | ‐ | ‐ | ‐ | ‐ | ‐ | ‐ | ‐ | ‐ | ‐ | ‐ |
| Total 1Q/2Q 2021 | ‐51.2% to ‐45.9% | ‐69.4% to ‐61.6% | ‐38.3% to ‐34.8% | ‐1,469,443 to ‐1,283,862 | ‐63.5% to ‐55.5% | ‐763,107 to ‐675,485 | ‐80.9% to ‐71.6% | ‐706,336 to ‐608,378 | ‐51.5% to ‐44.4% | ‐203,529 to ‐178,373 | ‐138,635 to ‐122,919 | ‐64,894 to ‐55,455 |
Seat capacity
Seat capacity
| Seat Capacity (thousand) ‐ World Total International | |||||||||||||||||||
| Year | 2019 | 2020 | 2021 | ||||||||||||||||
| Month | Actual | Baseline | Estimated | Compared to 2019 | Compared to Baseline | Baseline | Scenario 1 | Scenario 1a | Scenario 2 | Scenario 2a | Reference | Compared to 2019 | Compared to 2020 | Compared to Baseline | |||||
| a | b | c | c‐a | c/a‐1 | c‐b | c/b‐1 | d | e | ‐ | e‐a | e/a‐1 | e‐c | e/a‐1 | e‐d | e/d‐1 | ||||
| January | 176,978 | 182,100 | 180,601 | 3,623 | 2.0% | ‐1,499 | ‐0.8% | 185,913 | 42,942 | 42,942 | 42,942 | 42,942 | 42,942 | ‐134,036 | ‐75.7% | ‐137,659 | ‐76.2% | ‐142,970 | ‐76.9% |
| February | 161,254 | 170,721 | 153,407 | ‐7,847 | ‐4.9% | ‐17,314 | ‐10.1% | 174,489 | 39,674 | 39,674 | 39,018 | 38,366 | 41,426 | ‐122,888 to ‐121,580 | ‐76.2% to ‐75.4% | ‐115,041 to ‐113,733 | ‐75.0% to ‐74.1% | ‐136,123 to ‐134,815 | ‐78.0% to ‐77.3% |
| March | 180,012 | 185,993 | 96,871 | ‐83,141 | ‐46.2% | ‐89,121 | ‐47.9% | 188,739 | 56,259 | 56,259 | 53,025 | 51,446 | 74,252 | ‐128,566 to ‐123,752 | ‐71.4% to ‐68.7% | ‐45,426 to ‐40,612 | ‐46.9% to ‐41.9% | ‐137,294 to ‐132,480 | ‐72.7% to ‐70.2% |
| April | 186,932 | 193,072 | 12,235 | ‐174,698 | ‐93.5% | ‐180,837 | ‐93.7% | 199,119 | 76,784 | 63,958 | 68,541 | 63,430 | 143,564 | ‐123,502 to ‐110,148 | ‐66.1% to ‐58.9% | 51,195 to 64,549 | 418.4% to 527.6% | ‐135,689 to ‐122,335 | ‐68.1% to ‐61.4% |
| May | 196,406 | 202,540 | 13,634 | ‐182,772 | ‐93.1% | ‐188,907 | ‐93.3% | 207,749 | 101,373 | 75,523 | 86,322 | 74,495 | 159,107 | ‐121,911 to ‐95,033 | ‐62.1% to ‐48.4% | 60,861 to 87,740 | 446.4% to 643.5% | ‐133,253 to ‐106,375 | ‐64.1% to ‐51.2% |
| June | 203,503 | 210,916 | 20,373 | ‐183,131 | ‐90.0% | ‐190,544 | ‐90.3% | 218,921 | 134,582 | 97,201 | 113,110 | 88,509 | 165,655 | ‐114,995 to ‐68,922 | ‐56.5% to ‐33.9% | 68,136 to 114,209 | 334.4% to 560.6% | ‐130,412 to ‐84,339 | ‐59.6% to ‐38.5% |
| July | 216,729 | 223,515 | 48,106 | ‐168,623 | ‐77.8% | ‐175,409 | ‐78.5% | ‐ | ‐ | ‐ | ‐ | ‐ | ‐ | ‐ | ‐ | ‐ | ‐ | ‐ | ‐ |
| August | 217,510 | 224,145 | 63,311 | ‐154,199 | ‐70.9% | ‐160,834 | ‐71.8% | ‐ | ‐ | ‐ | ‐ | ‐ | ‐ | ‐ | ‐ | ‐ | ‐ | ‐ | ‐ |
| September | 200,919 | 206,601 | 54,611 | ‐146,308 | ‐72.8% | ‐151,990 | ‐73.6% | ‐ | ‐ | ‐ | ‐ | ‐ | ‐ | ‐ | ‐ | ‐ | ‐ | ‐ | ‐ |
| October | 195,761 | 199,203 | 52,395 | ‐143,366 | ‐73.2% | ‐146,808 | ‐73.7% | ‐ | ‐ | ‐ | ‐ | ‐ | ‐ | ‐ | ‐ | ‐ | ‐ | ‐ | ‐ |
| November | 171,168 | 174,618 | 40,601 | ‐130,567 | ‐76.3% | ‐134,017 | ‐76.7% | ‐ | ‐ | ‐ | ‐ | ‐ | ‐ | ‐ | ‐ | ‐ | ‐ | ‐ | ‐ |
| December | 180,939 | 187,587 | 48,010 | ‐132,929 | ‐73.5% | ‐139,576 | ‐74.4% | ‐ | ‐ | ‐ | ‐ | ‐ | ‐ | ‐ | ‐ | ‐ | ‐ | ‐ | ‐ |
| 1Q | 518,244 | 538,814 | 430,879 | ‐87,365 | ‐16.9% | ‐107,935 | ‐20.0% | 549,141 | 138,876 | 138,876 | 134,985 | 132,754 | 158,620 | ‐385,490 to ‐379,368 | ‐74.4% to ‐73.2% | ‐298,126 to ‐292,004 | ‐69.2% to ‐67.8% | ‐416,388 to ‐410,266 | ‐75.8% to ‐74.7% |
| 2Q | 586,842 | 606,529 | 46,241 | ‐540,601 | ‐92.1% | ‐560,288 | ‐92.4% | 625,788 | 312,739 | 236,681 | 267,972 | 226,434 | 468,325 | ‐360,408 to ‐274,103 | ‐61.4% to ‐46.7% | 180,193 to 266,498 | 389.7% to 576.3% | ‐399,354 to ‐313,049 | ‐63.8% to ‐50.0% |
| 3Q | 635,158 | 654,261 | 166,028 | ‐469,130 | ‐73.9% | ‐488,233 | ‐74.6% | ‐ | ‐ | ‐ | ‐ | ‐ | ‐ | ‐ | ‐ | ‐ | ‐ | ‐ | ‐ |
| 4Q | 547,868 | 561,408 | 141,006 | ‐406,861 | ‐74.3% | ‐420,402 | ‐74.9% | ‐ | ‐ | ‐ | ‐ | ‐ | ‐ | ‐ | ‐ | ‐ | ‐ | ‐ | ‐ |
| Total | 2,288,112 | 2,361,012 | 784,155 | ‐1,503,957 | ‐65.7% | ‐1,576,857 | ‐66.8% | 1,174,930 | 451,615 | 375,557 | 402,957 | 359,188 | 626,945 | ‐745,898 to ‐653,471 | ‐67.5% to ‐59.1% | ‐117,933 to ‐25,506 | ‐24.7% to ‐5.3% | ‐815,742 to ‐723,315 | ‐69.4% to ‐61.6% |
| Seat Capacity (thousand) ‐ World Total Domestic | |||||||||||||||||||
| Year | 2019 | 2020 | 2021 | ||||||||||||||||
| Month | Actual | Baseline | Estimated | Compared to 2019 | Compared to Baseline | Baseline | Scenario 1 | Scenario 1a | Scenario 2 | Scenario 2a | Reference | Compared to 2019 | Compared to 2020 | Compared to Baseline | |||||
| a | b | c | c‐a | c/a‐1 | c‐b | c/b‐1 | d | e | ‐ | e‐a | e/a‐1 | e‐c | e/a‐1 | e‐d | e/d‐1 | ||||
| January | 261,967 | 270,837 | 265,303 | 3,337 | 1.3% | ‐5,534 | ‐2.0% | 278,707 | 163,157 | 163,157 | 163,157 | 163,157 | 163,157 | ‐98,809 | ‐37.7% | ‐102,146 | ‐38.5% | ‐115,550 | ‐41.5% |
| February | 239,777 | 253,127 | 209,236 | ‐30,541 | ‐12.7% | ‐43,890 | ‐17.3% | 259,006 | 154,063 | 154,063 | 152,625 | 150,075 | 180,522 | ‐89,702 to ‐85,714 | ‐37.4% to ‐35.7% | ‐59,161 to ‐55,173 | ‐28.3% to ‐26.4% | ‐108,931 to ‐104,943 | ‐42.1% to ‐40.5% |
| March | 264,232 | 272,047 | 188,615 | ‐75,616 | ‐28.6% | ‐83,432 | ‐30.7% | 276,428 | 172,573 | 172,573 | 169,040 | 168,221 | 239,507 | ‐96,010 to ‐91,659 | ‐36.3% to ‐34.7% | ‐20,394 to ‐16,042 | ‐10.8% to ‐8.5% | ‐108,207 to ‐103,855 | ‐39.1% to ‐37.6% |
| April | 258,338 | 264,499 | 69,753 | ‐188,585 | ‐73.0% | ‐194,747 | ‐73.6% | 270,598 | 175,919 | 170,182 | 169,981 | 167,691 | 240,745 | ‐90,647 to ‐82,420 | ‐35.1% to ‐31.9% | 97,939 to 106,166 | 140.4% to 152.2% | ‐102,907 to ‐94,679 | ‐38.0% to ‐35.0% |
| May | 268,542 | 276,163 | 77,868 | ‐190,674 | ‐71.0% | ‐198,295 | ‐71.8% | 283,309 | 197,835 | 183,587 | 188,573 | 181,723 | 251,814 | ‐86,819 to ‐70,707 | ‐32.3% to ‐26.3% | 103,855 to 119,967 | 133.4% to 154.1% | ‐101,586 to ‐85,474 | ‐35.9% to ‐30.2% |
| June | 266,508 | 274,988 | 108,085 | ‐158,423 | ‐59.4% | ‐166,903 | ‐60.7% | 281,455 | 211,514 | 195,333 | 200,712 | 186,937 | 248,364 | ‐79,571 to ‐54,993 | ‐29.9% to ‐20.6% | 78,852 to 103,430 | 73.0% to 95.7% | ‐94,518 to ‐69,941 | ‐33.6% to ‐24.8% |
| July | 281,611 | 291,592 | 156,596 | ‐125,015 | ‐44.4% | ‐134,996 | ‐46.3% | ‐ | ‐ | ‐ | ‐ | ‐ | ‐ | ‐ | ‐ | ‐ | ‐ | ‐ | ‐ |
| August | 279,906 | 286,688 | 173,728 | ‐106,178 | ‐37.9% | ‐112,961 | ‐39.4% | ‐ | ‐ | ‐ | ‐ | ‐ | ‐ | ‐ | ‐ | ‐ | ‐ | ‐ | ‐ |
| September | 265,750 | 274,756 | 164,001 | ‐101,749 | ‐38.3% | ‐110,755 | ‐40.3% | ‐ | ‐ | ‐ | ‐ | ‐ | ‐ | ‐ | ‐ | ‐ | ‐ | ‐ | ‐ |
| October | 273,774 | 279,499 | 186,635 | ‐87,139 | ‐31.8% | ‐92,865 | ‐33.2% | ‐ | ‐ | ‐ | ‐ | ‐ | ‐ | ‐ | ‐ | ‐ | ‐ | ‐ | ‐ |
| November | 260,029 | 264,639 | 183,392 | ‐76,638 | ‐29.5% | ‐81,247 | ‐30.7% | ‐ | ‐ | ‐ | ‐ | ‐ | ‐ | ‐ | ‐ | ‐ | ‐ | ‐ | ‐ |
| December | 267,385 | 274,568 | 195,429 | ‐71,956 | ‐26.9% | ‐79,139 | ‐28.8% | ‐ | ‐ | ‐ | ‐ | ‐ | ‐ | ‐ | ‐ | ‐ | ‐ | ‐ | ‐ |
| 1Q | 765,975 | 796,011 | 663,155 | ‐102,820 | ‐13.4% | ‐132,856 | ‐16.7% | 814,141 | 489,793 | 489,793 | 484,822 | 481,453 | 583,187 | ‐284,521 to ‐276,182 | ‐37.1% to ‐36.1% | ‐181,701 to ‐173,362 | ‐27.4% to ‐26.1% | ‐332,688 to ‐324,348 | ‐40.9% to ‐39.8% |
| 2Q | 793,388 | 815,650 | 255,705 | ‐537,683 | ‐67.8% | ‐559,945 | ‐68.7% | 835,362 | 585,268 | 549,102 | 559,267 | 536,351 | 740,923 | ‐257,037 to ‐208,120 | ‐32.4% to ‐26.2% | 280,646 to 329,563 | 109.8% to 128.9% | ‐299,011 to ‐250,094 | ‐35.8% to ‐29.9% |
| 3Q | 827,267 | 853,036 | 494,325 | ‐332,942 | ‐40.2% | ‐358,711 | ‐42.1% | ‐ | ‐ | ‐ | ‐ | ‐ | ‐ | ‐ | ‐ | ‐ | ‐ | ‐ | ‐ |
| 4Q | 801,189 | 818,706 | 565,456 | ‐235,733 | ‐29.4% | ‐253,250 | ‐30.9% | ‐ | ‐ | ‐ | ‐ | ‐ | ‐ | ‐ | ‐ | ‐ | ‐ | ‐ | ‐ |
| Total | 3,187,818 | 3,283,402 | 1,978,640 | ‐1,209,178 | ‐37.9% | ‐1,304,762 | ‐39.7% | 1,649,503 | 1,075,061 | 1,038,895 | 1,044,089 | 1,017,805 | 1,324,110 | ‐541,558 to ‐484,302 | ‐34.7% to ‐31.1% | 98,945 to 156,201 | 10.8% to 17.0% | ‐631,699 to ‐574,442 | ‐38.3% to ‐34.8% |
Passenger number
Passenger number
| Passenger Number (thousand) ‐ World Total International | |||||||||||||||||||
| Year | 2019 | 2020 | 2021 | ||||||||||||||||
| Month | Actual | Baseline | Estimated | Compared to 2019 | Compared to Baseline | Baseline | Scenario 1 | Scenario 1a | Scenario 2 | Scenario 2a | Reference | Compared to 2019 | Compared to 2020 | Compared to Baseline | |||||
| a | b | c | c‐a | c/a‐1 | c‐b | c/b‐1 | d | e | ‐ | e‐a | e/a‐1 | e‐c | e/a‐1 | e‐d | e/d‐1 | ||||
| January | 138,869 | 143,559 | 144,651 | 5,782 | 4.2% | 1,092 | 0.8% | 146,430 | 20,119 | 20,119 | 20,119 | 20,119 | 20,119 | ‐118,750 | ‐85.5% | ‐124,532 | ‐86.1% | ‐126,311 | ‐86.3% |
| February | 126,274 | 134,312 | 113,965 | ‐12,309 | ‐9.7% | ‐20,347 | ‐15.1% | 137,129 | 19,572 | 19,572 | 18,658 | 17,763 | 21,301 | ‐108,512 to ‐106,702 | ‐85.9% to ‐84.5% | ‐96,203 to ‐94,393 | ‐84.4% to ‐82.8% | ‐119,366 to ‐117,557 | ‐87.0% to ‐85.7% |
| March | 143,342 | 148,787 | 59,947 | ‐83,396 | ‐58.2% | ‐88,841 | ‐59.7% | 150,771 | 30,480 | 28,404 | 27,356 | 24,905 | 41,800 | ‐118,437 to ‐112,862 | ‐82.6% to ‐78.7% | ‐35,042 to ‐29,467 | ‐58.5% to ‐49.2% | ‐125,866 to ‐120,291 | ‐83.5% to ‐79.8% |
| April | 152,775 | 158,563 | 3,455 | ‐149,319 | ‐97.7% | ‐155,108 | ‐97.8% | 163,234 | 46,132 | 33,734 | 38,204 | 32,136 | 89,192 | ‐120,638 to ‐106,642 | ‐79.0% to ‐69.8% | 28,681 to 42,677 | 830.1% to 1235.1% | ‐131,097 to ‐117,101 | ‐80.3% to ‐71.7% |
| May | 155,717 | 161,145 | 4,251 | ‐151,466 | ‐97.3% | ‐156,894 | ‐97.4% | 164,792 | 61,642 | 40,120 | 48,005 | 37,030 | 99,940 | ‐118,687 to ‐94,075 | ‐76.2% to ‐60.4% | 32,779 to 57,391 | 771.1% to 1350.1% | ‐127,762 to ‐103,150 | ‐77.5% to ‐62.6% |
| June | 167,747 | 174,732 | 8,306 | ‐159,440 | ‐95.0% | ‐166,425 | ‐95.2% | 180,958 | 89,883 | 57,363 | 69,959 | 48,254 | 113,824 | ‐119,493 to ‐77,864 | ‐71.2% to ‐46.4% | 39,947 to 81,577 | 480.9% to 982.1% | ‐132,704 to ‐91,075 | ‐73.3% to ‐50.3% |
| July | 182,234 | 188,889 | 22,578 | ‐159,657 | ‐87.6% | ‐166,311 | ‐88.0% | ‐ | ‐ | ‐ | ‐ | ‐ | ‐ | ‐ | ‐ | ‐ | ‐ | ‐ | ‐ |
| August | 183,824 | 190,357 | 31,247 | ‐152,577 | ‐83.0% | ‐159,111 | ‐83.6% | ‐ | ‐ | ‐ | ‐ | ‐ | ‐ | ‐ | ‐ | ‐ | ‐ | ‐ | ‐ |
| September | 161,695 | 167,106 | 24,523 | ‐137,171 | ‐84.8% | ‐142,582 | ‐85.3% | ‐ | ‐ | ‐ | ‐ | ‐ | ‐ | ‐ | ‐ | ‐ | ‐ | ‐ | ‐ |
| October | 156,574 | 160,000 | 22,468 | ‐134,106 | ‐85.7% | ‐137,531 | ‐86.0% | ‐ | ‐ | ‐ | ‐ | ‐ | ‐ | ‐ | ‐ | ‐ | ‐ | ‐ | ‐ |
| November | 135,195 | 138,497 | 16,686 | ‐118,509 | ‐87.7% | ‐121,812 | ‐88.0% | ‐ | ‐ | ‐ | ‐ | ‐ | ‐ | ‐ | ‐ | ‐ | ‐ | ‐ | ‐ |
| December | 145,817 | 151,856 | 22,323 | ‐123,494 | ‐84.7% | ‐129,533 | ‐85.3% | ‐ | ‐ | ‐ | ‐ | ‐ | ‐ | ‐ | ‐ | ‐ | ‐ | ‐ | ‐ |
| 1Q | 408,486 | 426,658 | 318,563 | ‐89,922 | ‐22.0% | ‐108,095 | ‐25.3% | 434,330 | 70,171 | 68,095 | 66,133 | 62,787 | 83,220 | ‐345,699 to ‐338,314 | ‐84.6% to ‐82.8% | ‐255,777 to ‐248,392 | ‐80.3% to ‐78.0% | ‐371,544 to ‐364,159 | ‐85.5% to ‐83.8% |
| 2Q | 476,238 | 494,440 | 16,012 | ‐460,226 | ‐96.6% | ‐478,427 | ‐96.8% | 508,984 | 197,658 | 131,217 | 156,168 | 117,420 | 302,956 | ‐358,819 to ‐278,581 | ‐75.3% to ‐58.5% | 101,407 to 181,645 | 633.3% to 1134.4% | ‐391,564 to ‐311,326 | ‐76.9% to ‐61.2% |
| 3Q | 527,753 | 546,352 | 78,348 | ‐449,405 | ‐85.2% | ‐468,004 | ‐85.7% | ‐ | ‐ | ‐ | ‐ | ‐ | ‐ | ‐ | ‐ | ‐ | ‐ | ‐ | ‐ |
| 4Q | 437,587 | 450,353 | 61,477 | ‐376,110 | ‐86.0% | ‐388,876 | ‐86.3% | ‐ | ‐ | ‐ | ‐ | ‐ | ‐ | ‐ | ‐ | ‐ | ‐ | ‐ | ‐ |
| Total | 1,850,064 | 1,917,803 | 474,401 | ‐1,375,663 | ‐74.4% | ‐1,443,402 | ‐75.3% | 943,314 | 267,829 | 199,312 | 222,301 | 180,206 | 386,176 | ‐704,518 to ‐616,895 | ‐79.6% to ‐69.7% | ‐154,369 to ‐66,747 | ‐46.1% to ‐19.9% | ‐763,107 to ‐675,485 | ‐80.9% to ‐71.6% |
| Passenger Number (thousand) ‐ World Total Domestic | |||||||||||||||||||
| Year | 2019 | 2020 | 2021 | ||||||||||||||||
| Month | Actual | Baseline | Estimated | Compared to 2019 | Compared to Baseline | Baseline | Scenario 1 | Scenario 1a | Scenario 2 | Scenario 2a | Reference | Compared to 2019 | Compared to 2020 | Compared to Baseline | |||||
| a | b | c | c‐a | c/a‐1 | c‐b | c/b‐1 | d | e | ‐ | e‐a | e/a‐1 | e‐c | e/a‐1 | e‐d | e/d‐1 | ||||
| January | 205,889 | 214,046 | 208,109 | 2,220 | 1.1% | ‐5,937 | ‐2.8% | 221,296 | 100,440 | 100,440 | 100,440 | 100,440 | 100,440 | ‐105,449 | ‐51.2% | ‐107,669 | ‐51.7% | ‐120,857 | ‐54.6% |
| February | 195,599 | 207,636 | 160,206 | ‐35,393 | ‐18.1% | ‐47,430 | ‐22.8% | 213,448 | 101,914 | 101,914 | 99,702 | 96,776 | 124,497 | ‐98,823 to ‐93,685 | ‐50.5% to ‐47.9% | ‐63,430 to ‐58,292 | ‐39.6% to ‐36.4% | ‐116,672 to ‐111,534 | ‐54.7% to ‐52.3% |
| March | 219,524 | 227,162 | 108,708 | ‐110,817 | ‐50.5% | ‐118,454 | ‐52.1% | 231,842 | 121,162 | 114,169 | 113,668 | 110,116 | 174,651 | ‐109,408 to ‐98,362 | ‐49.8% to ‐44.8% | 1,409 to 12,454 | 1.3% to 11.5% | ‐121,725 to ‐110,680 | ‐52.5% to ‐47.7% |
| April | 213,930 | 220,133 | 27,357 | ‐186,573 | ‐87.2% | ‐192,776 | ‐87.6% | 226,123 | 127,259 | 111,981 | 115,541 | 109,162 | 179,278 | ‐104,768 to ‐86,671 | ‐49.0% to ‐40.5% | 81,805 to 99,902 | 299.0% to 365.2% | ‐116,962 to ‐98,865 | ‐51.7% to ‐43.7% |
| May | 222,878 | 230,346 | 43,785 | ‐179,093 | ‐80.4% | ‐186,560 | ‐81.0% | 237,295 | 147,260 | 123,987 | 130,769 | 119,953 | 193,541 | ‐102,925 to ‐75,618 | ‐46.2% to ‐33.9% | 76,168 to 103,475 | 174.0% to 236.3% | ‐117,342 to ‐90,035 | ‐49.4% to ‐37.9% |
| June | 226,049 | 234,482 | 67,499 | ‐158,550 | ‐70.1% | ‐166,983 | ‐71.2% | 240,914 | 164,507 | 138,183 | 145,949 | 128,136 | 199,811 | ‐97,914 to ‐61,543 | ‐43.3% to ‐27.2% | 60,637 to 97,008 | 89.8% to 143.7% | ‐112,778 to ‐76,407 | ‐46.8% to ‐31.7% |
| July | 240,556 | 250,431 | 98,503 | ‐142,053 | ‐59.1% | ‐151,928 | ‐60.7% | ‐ | ‐ | ‐ | ‐ | ‐ | ‐ | ‐ | ‐ | ‐ | ‐ | ‐ | ‐ |
| August | 237,365 | 244,224 | 110,320 | ‐127,045 | ‐53.5% | ‐133,905 | ‐54.8% | ‐ | ‐ | ‐ | ‐ | ‐ | ‐ | ‐ | ‐ | ‐ | ‐ | ‐ | ‐ |
| September | 216,553 | 224,995 | 113,807 | ‐102,747 | ‐47.4% | ‐111,188 | ‐49.4% | ‐ | ‐ | ‐ | ‐ | ‐ | ‐ | ‐ | ‐ | ‐ | ‐ | ‐ | ‐ |
| October | 226,258 | 232,206 | 130,266 | ‐95,992 | ‐42.4% | ‐101,940 | ‐43.9% | ‐ | ‐ | ‐ | ‐ | ‐ | ‐ | ‐ | ‐ | ‐ | ‐ | ‐ | ‐ |
| November | 211,808 | 216,711 | 121,122 | ‐90,686 | ‐42.8% | ‐95,589 | ‐44.1% | ‐ | ‐ | ‐ | ‐ | ‐ | ‐ | ‐ | ‐ | ‐ | ‐ | ‐ | ‐ |
| December | 219,737 | 226,854 | 123,527 | ‐96,210 | ‐43.8% | ‐103,327 | ‐45.5% | ‐ | ‐ | ‐ | ‐ | ‐ | ‐ | ‐ | ‐ | ‐ | ‐ | ‐ | ‐ |
| 1Q | 621,012 | 648,844 | 477,023 | ‐143,990 | ‐23.2% | ‐171,821 | ‐26.5% | 666,586 | 323,516 | 316,523 | 313,809 | 307,332 | 399,588 | ‐313,680 to ‐297,497 | ‐50.5% to ‐47.9% | ‐169,691 to ‐153,507 | ‐35.6% to ‐32.2% | ‐359,254 to ‐343,071 | ‐53.9% to ‐51.5% |
| 2Q | 662,858 | 684,961 | 138,641 | ‐524,217 | ‐79.1% | ‐546,320 | ‐79.8% | 704,332 | 439,025 | 374,151 | 392,258 | 357,251 | 572,630 | ‐305,607 to ‐223,832 | ‐46.1% to ‐33.8% | 218,610 to 300,384 | 157.7% to 216.7% | ‐347,081 to ‐265,307 | ‐49.3% to ‐37.7% |
| 3Q | 694,475 | 719,650 | 322,630 | ‐371,846 | ‐53.5% | ‐397,020 | ‐55.2% | ‐ | ‐ | ‐ | ‐ | ‐ | ‐ | ‐ | ‐ | ‐ | ‐ | ‐ | ‐ |
| 4Q | 657,803 | 675,771 | 374,915 | ‐282,888 | ‐43.0% | ‐300,856 | ‐44.5% | ‐ | ‐ | ‐ | ‐ | ‐ | ‐ | ‐ | ‐ | ‐ | ‐ | ‐ | ‐ |
| Total | 2,636,148 | 2,729,225 | 1,313,208 | ‐1,322,940 | ‐50.2% | ‐1,416,017 | ‐51.9% | 1,370,919 | 762,541 | 690,674 | 706,067 | 664,583 | 972,219 | ‐619,287 to ‐521,329 | ‐48.2% to ‐40.6% | 48,919 to 146,877 | 7.9% to 23.9% | ‐706,336 to ‐608,378 | ‐51.5% to ‐44.4% |
Passenger revenue
Passenger revenue
| Passenger revenue (USD, million) ‐ World Total International | |||||||||||||||||||
| Year | 2019 | 2020 | 2021 | ||||||||||||||||
| Month | Actual | Baseline | Estimated | Compared to 2019 | Compared to Baseline | Baseline | Scenario 1 | Scenario 1a | Scenario 2 | Scenario 2a | Reference | Compared to 2019 | Compared to 2020 | Compared to Baseline | |||||
| a | b | c | c‐a | c/a‐1 | c‐b | c/b‐1 | d | e | ‐ | e‐a | e/a‐1 | e‐c | e/a‐1 | e‐d | e/d‐1 | ||||
| January | 26,170 | 27,114 | 27,464 | 1,294 | 4.9% | 350 | 1.3% | 27,730 | 3,868 | 3,868 | 3,868 | 3,868 | 3,868 | ‐22,302 | ‐85.2% | ‐23,596 | ‐85.9% | ‐23,862 | ‐86.0% |
| February | 23,567 | 25,037 | 20,977 | ‐2,590 | ‐11.0% | ‐4,060 | ‐16.2% | 25,499 | 3,797 | 3,797 | 3,615 | 3,439 | 4,143 | ‐20,128 to ‐19,770 | ‐85.4% to ‐83.9% | ‐17,538 to ‐17,180 | ‐83.6% to ‐81.9% | ‐22,061 to ‐21,702 | ‐86.5% to ‐85.1% |
| March | 26,649 | 27,457 | 11,407 | ‐15,242 | ‐57.2% | ‐16,049 | ‐58.5% | 27,791 | 5,749 | 5,348 | 5,165 | 4,699 | 7,828 | ‐21,950 to ‐20,900 | ‐82.4% to ‐78.4% | ‐6,708 to ‐5,658 | ‐58.8% to ‐49.6% | ‐23,092 to ‐22,042 | ‐83.1% to ‐79.3% |
| April | 27,581 | 28,574 | 722 | ‐26,859 | ‐97.4% | ‐27,852 | ‐97.5% | 29,462 | 8,500 | 6,247 | 7,060 | 5,943 | 16,085 | ‐21,638 to ‐19,081 | ‐78.5% to ‐69.2% | 5,221 to 7,778 | 723.5% to 1077.8% | ‐23,519 to ‐20,962 | ‐79.8% to ‐71.2% |
| May | 27,736 | 28,837 | 842 | ‐26,894 | ‐97.0% | ‐27,995 | ‐97.1% | 29,655 | 11,209 | 7,364 | 8,764 | 6,785 | 18,009 | ‐20,951 to ‐16,527 | ‐75.5% to ‐59.6% | 5,943 to 10,368 | 706.1% to 1231.8% | ‐22,871 to ‐18,446 | ‐77.1% to ‐62.2% |
| June | 29,710 | 30,847 | 1,470 | ‐28,240 | ‐95.1% | ‐29,378 | ‐95.2% | 31,949 | 16,045 | 10,344 | 12,532 | 8,718 | 20,557 | ‐20,991 to ‐13,665 | ‐70.7% to ‐46.0% | 7,249 to 14,575 | 493.3% to 991.8% | ‐23,231 to ‐15,905 | ‐72.7% to ‐49.8% |
| July | 32,311 | 33,472 | 3,343 | ‐28,968 | ‐89.7% | ‐30,130 | ‐90.0% | ‐ | ‐ | ‐ | ‐ | ‐ | ‐ | ‐ | ‐ | ‐ | ‐ | ‐ | ‐ |
| August | 32,648 | 33,853 | 4,483 | ‐28,164 | ‐86.3% | ‐29,369 | ‐86.8% | ‐ | ‐ | ‐ | ‐ | ‐ | ‐ | ‐ | ‐ | ‐ | ‐ | ‐ | ‐ |
| September | 28,633 | 29,576 | 3,763 | ‐24,869 | ‐86.9% | ‐25,813 | ‐87.3% | ‐ | ‐ | ‐ | ‐ | ‐ | ‐ | ‐ | ‐ | ‐ | ‐ | ‐ | ‐ |
| October | 28,049 | 28,741 | 3,752 | ‐24,297 | ‐86.6% | ‐24,989 | ‐86.9% | ‐ | ‐ | ‐ | ‐ | ‐ | ‐ | ‐ | ‐ | ‐ | ‐ | ‐ | ‐ |
| November | 25,200 | 25,884 | 3,166 | ‐22,033 | ‐87.4% | ‐22,717 | ‐87.8% | ‐ | ‐ | ‐ | ‐ | ‐ | ‐ | ‐ | ‐ | ‐ | ‐ | ‐ | ‐ |
| December | 27,503 | 28,613 | 4,226 | ‐23,277 | ‐84.6% | ‐24,387 | ‐85.2% | ‐ | ‐ | ‐ | ‐ | ‐ | ‐ | ‐ | ‐ | ‐ | ‐ | ‐ | ‐ |
| 1Q | 76,386 | 79,608 | 59,849 | ‐16,538 | ‐21.7% | ‐19,759 | ‐24.8% | 81,021 | 13,415 | 13,014 | 12,648 | 12,006 | 15,840 | ‐64,380 to ‐62,972 | ‐84.3% to ‐82.4% | ‐47,842 to ‐46,434 | ‐79.9% to ‐77.6% | ‐69,014 to ‐67,606 | ‐85.2% to ‐83.4% |
| 2Q | 85,026 | 88,258 | 3,033 | ‐81,993 | ‐96.4% | ‐85,225 | ‐96.6% | 91,066 | 35,754 | 23,956 | 28,356 | 21,446 | 54,651 | ‐63,581 to ‐49,273 | ‐74.8% to ‐57.9% | 18,413 to 32,721 | 607.1% to 1078.9% | ‐69,621 to ‐55,313 | ‐76.5% to ‐60.7% |
| 3Q | 93,592 | 96,901 | 11,589 | ‐82,002 | ‐87.6% | ‐85,312 | ‐88.0% | ‐ | ‐ | ‐ | ‐ | ‐ | ‐ | ‐ | ‐ | ‐ | ‐ | ‐ | ‐ |
| 4Q | 80,753 | 83,238 | 11,145 | ‐69,608 | ‐86.2% | ‐72,094 | ‐86.6% | ‐ | ‐ | ‐ | ‐ | ‐ | ‐ | ‐ | ‐ | ‐ | ‐ | ‐ | ‐ |
| Total | 335,757 | 348,005 | 85,615 | ‐250,141 | ‐74.5% | ‐262,390 | ‐75.4% | 172,087 | 49,168 | 36,969 | 41,004 | 33,452 | 70,491 | ‐127,961 to ‐112,244 | ‐79.3% to ‐69.5% | ‐29,429 to ‐13,713 | ‐46.8% to ‐21.8% | ‐138,635 to ‐122,919 | ‐80.6% to ‐71.4% |
| Passenger revenue (USD, million) ‐ World Total Domestic | |||||||||||||||||||
| Year | 2019 | 2020 | 2021 | ||||||||||||||||
| Month | Actual | Baseline | Estimated | Compared to 2019 | Compared to Baseline | Baseline | Scenario 1 | Scenario 1a | Scenario 2 | Scenario 2a | Reference | Compared to 2019 | Compared to 2020 | Compared to Baseline | |||||
| a | b | c | c‐a | c/a‐1 | c‐b | c/b‐1 | d | e | ‐ | e‐a | e/a‐1 | e‐c | e/a‐1 | e‐d | e/d‐1 | ||||
| January | 18,474 | 19,168 | 18,746 | 272 | 1.5% | ‐422 | ‐2.2% | 19,855 | 8,844 | 8,844 | 8,844 | 8,844 | 8,844 | ‐9,630 | ‐52.1% | ‐9,902 | ‐52.8% | ‐11,011 | ‐55.5% |
| February | 17,574 | 18,644 | 14,585 | ‐2,989 | ‐17.0% | ‐4,059 | ‐21.8% | 19,199 | 9,021 | 9,021 | 8,811 | 8,543 | 10,889 | ‐9,031 to ‐8,553 | ‐51.4% to ‐48.7% | ‐6,042 to ‐5,564 | ‐41.4% to ‐38.1% | ‐10,656 to ‐10,178 | ‐55.5% to ‐53.0% |
| March | 19,962 | 20,616 | 9,828 | ‐10,134 | ‐50.8% | ‐10,789 | ‐52.3% | 21,103 | 10,944 | 10,269 | 10,218 | 9,872 | 15,437 | ‐10,090 to ‐9,018 | ‐50.5% to ‐45.2% | 45 to 1,116 | 0.5% to 11.4% | ‐11,230 to ‐10,159 | ‐53.2% to ‐48.1% |
| April | 19,422 | 19,990 | 2,450 | ‐16,971 | ‐87.4% | ‐17,539 | ‐87.7% | 20,559 | 11,553 | 10,083 | 10,418 | 9,799 | 16,769 | ‐9,623 to ‐7,869 | ‐49.5% to ‐40.5% | 7,348 to 9,103 | 299.9% to 371.5% | ‐10,760 to ‐9,005 | ‐52.3% to ‐43.8% |
| May | 20,312 | 20,997 | 4,036 | ‐16,276 | ‐80.1% | ‐16,961 | ‐80.8% | 21,656 | 13,474 | 11,248 | 11,879 | 10,838 | 18,257 | ‐9,473 to ‐6,838 | ‐46.6% to ‐33.7% | 6,802 to 9,438 | 168.6% to 233.9% | ‐10,818 to ‐8,182 | ‐50.0% to ‐37.8% |
| June | 20,635 | 21,454 | 6,130 | ‐14,505 | ‐70.3% | ‐15,324 | ‐71.4% | 22,045 | 15,126 | 12,604 | 13,331 | 11,626 | 18,933 | ‐9,009 to ‐5,510 | ‐43.7% to ‐26.7% | 5,496 to 8,996 | 89.7% to 146.8% | ‐10,419 to ‐6,920 | ‐47.3% to ‐31.4% |
| July | 21,892 | 22,850 | 8,877 | ‐13,015 | ‐59.5% | ‐13,973 | ‐61.2% | ‐ | ‐ | ‐ | ‐ | ‐ | ‐ | ‐ | ‐ | ‐ | ‐ | ‐ | ‐ |
| August | 21,513 | 22,129 | 10,003 | ‐11,510 | ‐53.5% | ‐12,126 | ‐54.8% | ‐ | ‐ | ‐ | ‐ | ‐ | ‐ | ‐ | ‐ | ‐ | ‐ | ‐ | ‐ |
| September | 19,486 | 20,267 | 10,178 | ‐9,308 | ‐47.8% | ‐10,089 | ‐49.8% | ‐ | ‐ | ‐ | ‐ | ‐ | ‐ | ‐ | ‐ | ‐ | ‐ | ‐ | ‐ |
| October | 20,412 | 20,987 | 11,603 | ‐8,809 | ‐43.2% | ‐9,384 | ‐44.7% | ‐ | ‐ | ‐ | ‐ | ‐ | ‐ | ‐ | ‐ | ‐ | ‐ | ‐ | ‐ |
| November | 18,963 | 19,399 | 10,695 | ‐8,268 | ‐43.6% | ‐8,704 | ‐44.9% | ‐ | ‐ | ‐ | ‐ | ‐ | ‐ | ‐ | ‐ | ‐ | ‐ | ‐ | ‐ |
| December | 19,836 | 20,513 | 10,887 | ‐8,949 | ‐45.1% | ‐9,625 | ‐46.9% | ‐ | ‐ | ‐ | ‐ | ‐ | ‐ | ‐ | ‐ | ‐ | ‐ | ‐ | ‐ |
| 1Q | 56,010 | 58,428 | 43,159 | ‐12,852 | ‐22.9% | ‐15,269 | ‐26.1% | 60,157 | 28,809 | 28,134 | 27,873 | 27,259 | 35,170 | ‐28,751 to ‐27,202 | ‐51.3% to ‐48.6% | ‐15,900 to ‐14,350 | ‐36.8% to ‐33.2% | ‐32,898 to ‐31,348 | ‐54.7% to ‐52.1% |
| 2Q | 60,369 | 62,441 | 12,616 | ‐47,753 | ‐79.1% | ‐49,824 | ‐79.8% | 64,260 | 40,153 | 33,935 | 35,628 | 32,263 | 53,959 | ‐28,106 to ‐20,216 | ‐46.6% to ‐33.5% | 19,647 to 27,537 | 155.7% to 218.3% | ‐31,997 to ‐24,107 | ‐49.8% to ‐37.5% |
| 3Q | 62,891 | 65,246 | 29,058 | ‐33,833 | ‐53.8% | ‐36,188 | ‐55.5% | ‐ | ‐ | ‐ | ‐ | ‐ | ‐ | ‐ | ‐ | ‐ | ‐ | ‐ | ‐ |
| 4Q | 59,211 | 60,898 | 33,185 | ‐26,026 | ‐44.0% | ‐27,713 | ‐45.5% | ‐ | ‐ | ‐ | ‐ | ‐ | ‐ | ‐ | ‐ | ‐ | ‐ | ‐ | ‐ |
| Total | 238,482 | 247,013 | 118,018 | ‐120,464 | ‐50.5% | ‐128,996 | ‐52.2% | 124,416 | 68,962 | 62,069 | 63,500 | 59,522 | 89,129 | ‐56,857 to ‐47,418 | ‐48.9% to ‐40.7% | 3,747 to 13,187 | 6.7% to 23.6% | ‐64,894 to ‐55,455 | ‐52.2% to ‐44.6% |
Estimated 2020 Results and Near‐term Outlook:Region Breakdown
Figures and estimates herein reflect the latest operational data and schedules filed by airlines but are subject to substantial changes, and will be updated with the situation evolving and more information available.
Breakdown by ICAO statistical region
- Regional breakdown follows ICAO’s six (6) statistical regions (Doc 9060)
- The same key impact indicators are presented under four (4) paths of two (2) scenarios, in comparison to Baseline scenario, 2019 level and 2020 level, and by international and domestic, as well as month, quarter and year
- To avoid double counting:
- - Number of “international” passengers departing from each country and territory are aggregated in each region
- - Gross passenger operating revenues of all airlines serving “international” routes from each country and territory are aggregated at regional level
- Appendix C presents actual results from January to November 2020 by route group (40 international and 10 domestic route groups)
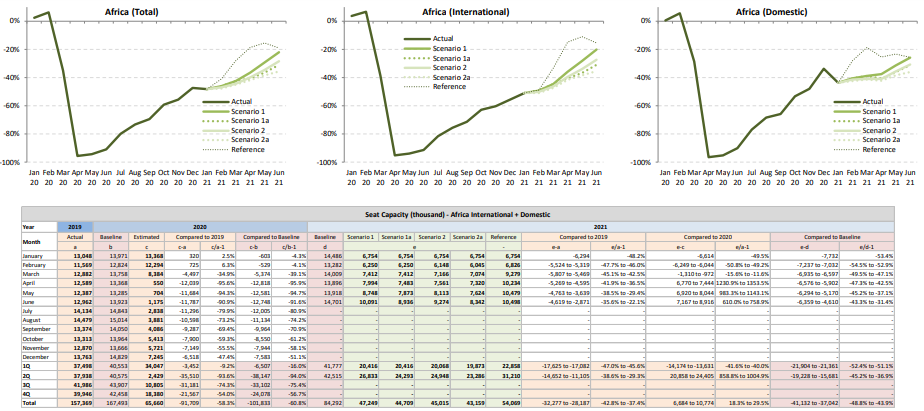
Seat capacity change compared to 2019: International + Domestic
Seat capacity change compared to 2019: International
Seat capacity change compared to 2019: Domestic
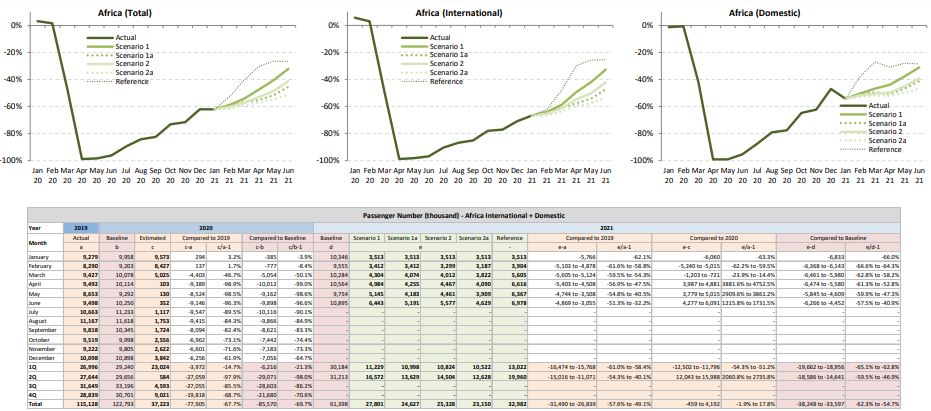
Passenger number change compared to 2019: International + Domestic
Passenger number change compared to 2019: International
Passenger number change compared to 2019: Domestic
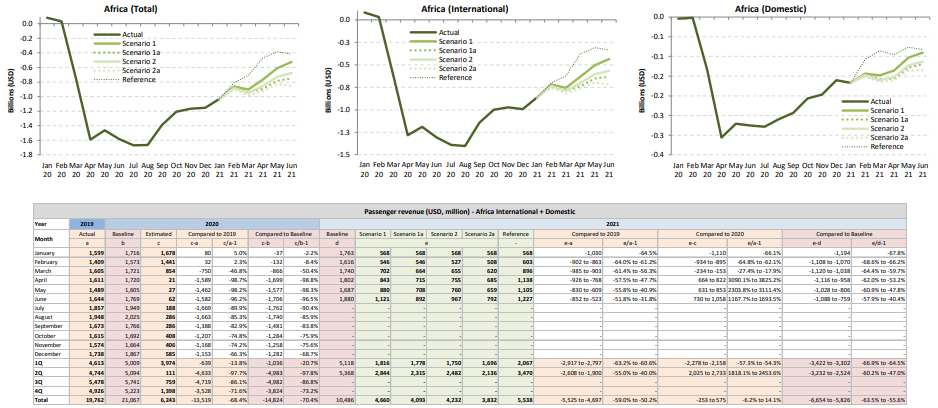
Passenger revenue change compared to 2019: International + Domestic
Passenger revenue change compared to 2019: International
Passenger revenue change compared to 2019: Domestic
| Compared to 2019 | Seat capacity (%) | Passenger number (thousand) | Passenger revenue (USD, million) | |||||||||
| Total | International | Domestic | Total | International | Domestic | Total | International | Domestic | ||||
| 1Q 2020 | ‐9.2% | ‐10.0% | ‐7.9% | ‐3,972 | ‐14.7% | ‐2,446 | ‐14.4% | ‐1,526 | ‐15.2% | ‐639 | ‐501 | ‐138 |
| 2Q 2020 | ‐93.6% | ‐93.4% | ‐93.9% | ‐27,059 | ‐97.9% | ‐17,663 | ‐97.9% | ‐9,396 | ‐97.8% | ‐4,633 | ‐3,781 | ‐852 |
| 3Q 2020 | ‐74.3% | ‐76.3% | ‐70.3% | ‐27,055 | ‐85.5% | ‐18,436 | ‐87.6% | ‐8,619 | ‐81.3% | ‐4,719 | ‐3,938 | ‐781 |
| 4Q 2020 | ‐54.0% | ‐59.6% | ‐44.9% | ‐19,818 | ‐68.7% | ‐13,604 | ‐75.3% | ‐6,214 | ‐57.7% | ‐3,528 | ‐2,964 | ‐563 |
| Total 2020 | ‐58.3% | ‐60.8% | ‐53.7% | ‐77,905 | ‐67.7% | ‐52,150 | ‐70.4% | ‐25,755 | ‐62.8% | ‐13,519 | ‐11,184 | ‐2,335 |
| 1Q 2021 | ‐47.0% to ‐45.6% | ‐49.7% to ‐48.3% | ‐42.5% to ‐41.0% | ‐16,474 to ‐15,768 | ‐61.0% to ‐58.4% | ‐11,149 to ‐10,706 | ‐65.8% to ‐63.2% | ‐5,325 to ‐5,061 | ‐53.0% to ‐50.4% | ‐2,917 to ‐2,797 | ‐2,434 to ‐2,338 | ‐483 to ‐459 |
| 2Q 2021 | ‐38.6% to ‐29.3% | ‐38.5% to ‐28.0% | ‐38.9% to ‐31.7% | ‐15,016 to ‐11,071 | ‐54.3% to ‐40.1% | ‐10,250 to ‐7,452 | ‐56.8% to ‐41.3% | ‐4,767 to ‐3,619 | ‐49.6% to ‐37.7% | ‐2,608 to ‐1,900 | ‐2,176 to ‐1,572 | ‐432 to ‐328 |
| 3Q 2021 | ‐ | ‐ | ‐ | ‐ | ‐ | ‐ | ‐ | ‐ | ‐ | ‐ | ‐ | ‐ |
| 4Q 2021 | ‐ | ‐ | ‐ | ‐ | ‐ | ‐ | ‐ | ‐ | ‐ | ‐ | ‐ | ‐ |
| Total 1Q/2Q 2021 | ‐42.8% to ‐37.4% | ‐43.9% to ‐37.9% | ‐40.8% to ‐36.4% | ‐31,490 to ‐26,839 | ‐57.6% to ‐49.1% | ‐21,398 to ‐18,158 | ‐61.2% to ‐51.9% | ‐10,092 to ‐8,681 | ‐51.3% to ‐44.2% | ‐5,525 to ‐4,697 | ‐4,610 to ‐3,910 | ‐915 to ‐787 |
Seat capacity
Seat capacity
| Seat Capacity (thousand) ‐ Africa International | |||||||||||||||||||
| Year | 2019 | 2020 | 2021 | ||||||||||||||||
| Month | Actual | Baseline | Estimated | Compared to 2019 | Compared to Baseline | Baseline | Scenario 1 | Scenario 1a | Scenario 2 | Scenario 2a | Reference | Compared to 2019 | Compared to 2020 | Compared to Baseline | |||||
| a | b | c | c‐a | c/a‐1 | c‐b | c/b‐1 | d | e | ‐ | e‐a | e/a‐1 | e‐c | e/a‐1 | e‐d | e/d‐1 | ||||
| January | 8,171 | 8,853 | 8,471 | 300 | 3.7% | ‐382 | ‐4.3% | 9,075 | 4,005 | 4,005 | 4,005 | 4,005 | 4,005 | ‐4,166 | ‐51.0% | ‐4,465 | ‐52.7% | ‐5,070 | ‐55.9% |
| February | 7,203 | 8,142 | 7,688 | 485 | 6.7% | ‐454 | ‐5.6% | 8,400 | 3,654 | 3,654 | 3,593 | 3,533 | 3,679 | ‐3,670 to ‐3,549 | ‐50.9% to ‐49.3% | ‐4,155 to ‐4,034 | ‐54.0% to ‐52.5% | ‐4,867 to ‐4,746 | ‐57.9% to ‐56.5% |
| March | 8,114 | 8,793 | 4,981 | ‐3,133 | ‐38.6% | ‐3,812 | ‐43.3% | 8,903 | 4,493 | 4,493 | 4,351 | 4,281 | 5,405 | ‐3,834 to ‐3,621 | ‐47.2% to ‐44.6% | ‐701 to ‐488 | ‐14.1% to ‐9.8% | ‐4,622 to ‐4,409 | ‐51.9% to ‐49.5% |
| April | 8,048 | 8,741 | 393 | ‐7,655 | ‐95.1% | ‐8,348 | ‐95.5% | 9,245 | 5,159 | 4,789 | 4,879 | 4,695 | 6,851 | ‐3,353 to ‐2,889 | ‐41.7% to ‐35.9% | 4,302 to 4,766 | 1094.7% to 1212.9% | ‐4,550 to ‐4,086 | ‐49.2% to ‐44.2% |
| May | 7,984 | 8,719 | 495 | ‐7,489 | ‐93.8% | ‐8,224 | ‐94.3% | 9,285 | 5,728 | 5,058 | 5,275 | 4,916 | 7,103 | ‐3,068 to ‐2,256 | ‐38.4% to ‐28.3% | 4,421 to 5,233 | 893.6% to 1057.7% | ‐4,369 to ‐3,557 | ‐47.1% to ‐38.3% |
| June | 8,495 | 9,291 | 727 | ‐7,768 | ‐91.4% | ‐8,564 | ‐92.2% | 9,964 | 6,781 | 5,867 | 6,179 | 5,485 | 7,177 | ‐3,010 to ‐1,714 | ‐35.4% to ‐20.2% | 4,758 to 6,054 | 654.6% to 832.8% | ‐4,478 to ‐3,183 | ‐44.9% to ‐31.9% |
| July | 9,364 | 9,969 | 1,731 | ‐7,634 | ‐81.5% | ‐8,238 | ‐82.6% | ‐ | ‐ | ‐ | ‐ | ‐ | ‐ | ‐ | ‐ | ‐ | ‐ | ‐ | ‐ |
| August | 9,643 | 10,171 | 2,349 | ‐7,294 | ‐75.6% | ‐7,822 | ‐76.9% | ‐ | ‐ | ‐ | ‐ | ‐ | ‐ | ‐ | ‐ | ‐ | ‐ | ‐ | ‐ |
| September | 8,574 | 9,168 | 2,448 | ‐6,126 | ‐71.5% | ‐6,721 | ‐73.3% | ‐ | ‐ | ‐ | ‐ | ‐ | ‐ | ‐ | ‐ | ‐ | ‐ | ‐ | ‐ |
| October | 8,296 | 8,800 | 3,075 | ‐5,221 | ‐62.9% | ‐5,725 | ‐65.1% | ‐ | ‐ | ‐ | ‐ | ‐ | ‐ | ‐ | ‐ | ‐ | ‐ | ‐ | ‐ |
| November | 7,916 | 8,486 | 3,140 | ‐4,776 | ‐60.3% | ‐5,346 | ‐63.0% | ‐ | ‐ | ‐ | ‐ | ‐ | ‐ | ‐ | ‐ | ‐ | ‐ | ‐ | ‐ |
| December | 8,562 | 9,275 | 3,799 | ‐4,762 | ‐55.6% | ‐5,476 | ‐59.0% | ‐ | ‐ | ‐ | ‐ | ‐ | ‐ | ‐ | ‐ | ‐ | ‐ | ‐ | ‐ |
| 1Q | 23,488 | 25,788 | 21,140 | ‐2,348 | ‐10.0% | ‐4,648 | ‐18.0% | 26,378 | 12,153 | 12,153 | 11,950 | 11,819 | 13,090 | ‐11,669 to ‐11,336 | ‐49.7% to ‐48.3% | ‐9,321 to ‐8,987 | ‐44.1% to ‐42.5% | ‐14,559 to ‐14,225 | ‐55.2% to ‐53.9% |
| 2Q | 24,527 | 26,751 | 1,615 | ‐22,913 | ‐93.4% | ‐25,137 | ‐94.0% | 28,493 | 17,668 | 15,714 | 16,333 | 15,096 | 21,130 | ‐9,431 to ‐6,859 | ‐38.5% to ‐28.0% | 13,481 to 16,053 | 835.0% to 994.2% | ‐13,397 to ‐10,825 | ‐47.0% to ‐38.0% |
| 3Q | 27,581 | 29,308 | 6,527 | ‐21,054 | ‐76.3% | ‐22,781 | ‐77.7% | ‐ | ‐ | ‐ | ‐ | ‐ | ‐ | ‐ | ‐ | ‐ | ‐ | ‐ | ‐ |
| 4Q | 24,774 | 26,561 | 10,015 | ‐14,759 | ‐59.6% | ‐16,547 | ‐62.3% | ‐ | ‐ | ‐ | ‐ | ‐ | ‐ | ‐ | ‐ | ‐ | ‐ | ‐ | ‐ |
| Total | 100,370 | 108,409 | 39,296 | ‐61,074 | ‐60.8% | ‐69,113 | ‐63.8% | 54,871 | 29,820 | 27,867 | 28,283 | 26,915 | 34,220 | ‐21,101 to ‐18,195 | ‐43.9% to ‐37.9% | 4,161 to 7,066 | 18.3% to 31.1% | ‐27,956 to ‐25,051 | ‐50.9% to ‐45.7% |
| Seat Capacity (thousand) ‐ Africa Domestic | |||||||||||||||||||
| Year | 2019 | 2020 | 2021 | ||||||||||||||||
| Month | Actual | Baseline | Estimated | Compared to 2019 | Compared to Baseline | Baseline | Scenario 1 | Scenario 1a | Scenario 2 | Scenario 2a | Reference | Compared to 2019 | Compared to 2020 | Compared to Baseline | |||||
| a | b | c | c‐a | c/a‐1 | c‐b | c/b‐1 | d | e | ‐ | e‐a | e/a‐1 | e‐c | e/a‐1 | e‐d | e/d‐1 | ||||
| January | 4,877 | 5,119 | 4,897 | 21 | 0.4% | ‐221 | ‐4.3% | 5,411 | 2,748 | 2,748 | 2,748 | 2,748 | 2,748 | ‐2,128 | ‐43.6% | ‐2,149 | ‐43.9% | ‐2,662 | ‐49.2% |
| February | 4,366 | 4,682 | 4,606 | 240 | 5.5% | ‐75 | ‐1.6% | 4,882 | 2,596 | 2,596 | 2,554 | 2,512 | 3,146 | ‐1,854 to ‐1,770 | ‐42.5% to ‐40.5% | ‐2,094 to ‐2,010 | ‐45.5% to ‐43.6% | ‐2,370 to ‐2,286 | ‐48.5% to ‐46.8% |
| March | 4,767 | 4,965 | 3,403 | ‐1,364 | ‐28.6% | ‐1,562 | ‐31.5% | 5,106 | 2,919 | 2,919 | 2,815 | 2,794 | 3,874 | ‐1,974 to ‐1,848 | ‐41.4% to ‐38.8% | ‐609 to ‐484 | ‐17.9% to ‐14.2% | ‐2,313 to ‐2,187 | ‐45.3% to ‐42.8% |
| April | 4,541 | 4,627 | 157 | ‐4,384 | ‐96.5% | ‐4,469 | ‐96.6% | 4,651 | 2,835 | 2,694 | 2,682 | 2,625 | 3,383 | ‐1,916 to ‐1,706 | ‐42.2% to ‐37.6% | 2,468 to 2,678 | 1571.7% to 1705.4% | ‐2,026 to ‐1,816 | ‐43.6% to ‐39.0% |
| May | 4,404 | 4,566 | 209 | ‐4,195 | ‐95.3% | ‐4,357 | ‐95.4% | 4,633 | 3,020 | 2,815 | 2,838 | 2,708 | 3,376 | ‐1,696 to ‐1,383 | ‐38.5% to ‐31.4% | 2,499 to 2,811 | 1195.7% to 1345.2% | ‐1,925 to ‐1,613 | ‐41.6% to ‐34.8% |
| June | 4,466 | 4,632 | 448 | ‐4,018 | ‐90.0% | ‐4,184 | ‐90.3% | 4,737 | 3,310 | 3,069 | 3,095 | 2,857 | 3,322 | ‐1,609 to ‐1,156 | ‐36.0% to ‐25.9% | 2,409 to 2,862 | 537.8% to 638.8% | ‐1,880 to ‐1,427 | ‐39.7% to ‐30.1% |
| July | 4,770 | 4,874 | 1,107 | ‐3,663 | ‐76.8% | ‐3,767 | ‐77.3% | ‐ | ‐ | ‐ | ‐ | ‐ | ‐ | ‐ | ‐ | ‐ | ‐ | ‐ | ‐ |
| August | 4,836 | 4,843 | 1,532 | ‐3,304 | ‐68.3% | ‐3,311 | ‐68.4% | ‐ | ‐ | ‐ | ‐ | ‐ | ‐ | ‐ | ‐ | ‐ | ‐ | ‐ | ‐ |
| September | 4,800 | 4,881 | 1,639 | ‐3,161 | ‐65.9% | ‐3,243 | ‐66.4% | ‐ | ‐ | ‐ | ‐ | ‐ | ‐ | ‐ | ‐ | ‐ | ‐ | ‐ | ‐ |
| October | 5,017 | 5,163 | 2,338 | ‐2,679 | ‐53.4% | ‐2,825 | ‐54.7% | ‐ | ‐ | ‐ | ‐ | ‐ | ‐ | ‐ | ‐ | ‐ | ‐ | ‐ | ‐ |
| November | 4,954 | 5,180 | 2,581 | ‐2,373 | ‐47.9% | ‐2,598 | ‐50.2% | ‐ | ‐ | ‐ | ‐ | ‐ | ‐ | ‐ | ‐ | ‐ | ‐ | ‐ | ‐ |
| December | 5,202 | 5,554 | 3,446 | ‐1,756 | ‐33.8% | ‐2,108 | ‐38.0% | ‐ | ‐ | ‐ | ‐ | ‐ | ‐ | ‐ | ‐ | ‐ | ‐ | ‐ | ‐ |
| 1Q | 14,010 | 14,765 | 12,907 | ‐1,103 | ‐7.9% | ‐1,859 | ‐12.6% | 15,399 | 8,263 | 8,263 | 8,118 | 8,054 | 9,769 | ‐5,956 to ‐5,746 | ‐42.5% to ‐41.0% | ‐4,853 to ‐4,643 | ‐37.6% to ‐36.0% | ‐7,345 to ‐7,136 | ‐47.7% to ‐46.3% |
| 2Q | 13,411 | 13,824 | 814 | ‐12,597 | ‐93.9% | ‐13,010 | ‐94.1% | 14,021 | 9,165 | 8,579 | 8,614 | 8,190 | 10,080 | ‐5,221 to ‐4,246 | ‐38.9% to ‐31.7% | 7,376 to 8,351 | 906.1% to 1025.9% | ‐5,831 to ‐4,856 | ‐41.6% to ‐34.6% |
| 3Q | 14,405 | 14,599 | 4,278 | ‐10,128 | ‐70.3% | ‐10,321 | ‐70.7% | ‐ | ‐ | ‐ | ‐ | ‐ | ‐ | ‐ | ‐ | ‐ | ‐ | ‐ | ‐ |
| 4Q | 15,172 | 15,896 | 8,365 | ‐6,807 | ‐44.9% | ‐7,531 | ‐47.4% | ‐ | ‐ | ‐ | ‐ | ‐ | ‐ | ‐ | ‐ | ‐ | ‐ | ‐ | ‐ |
| Total | 56,999 | 59,084 | 26,364 | ‐30,635 | ‐53.7% | ‐32,721 | ‐55.4% | 29,420 | 17,429 | 16,842 | 16,732 | 16,244 | 19,849 | ‐11,176 to ‐9,992 | ‐40.8% to ‐36.4% | 2,524 to 3,708 | 18.4% to 27.0% | ‐13,176 to ‐11,992 | ‐44.8% to ‐40.8% |
Passenger number
Passenger number
| Passenger Number (thousand) ‐ Africa International | |||||||||||||||||||
| Year | 2019 | 2020 | 2021 | ||||||||||||||||
| Month | Actual | Baseline | Estimated | Compared to 2019 | Compared to Baseline | Baseline | Scenario 1 | Scenario 1a | Scenario 2 | Scenario 2a | Reference | Compared to 2019 | Compared to 2020 | Compared to Baseline | |||||
| a | b | c | c‐a | c/a‐1 | c‐b | c/b‐1 | d | e | ‐ | e‐a | e/a‐1 | e‐c | e/a‐1 | e‐d | e/d‐1 | ||||
| January | 5,871 | 6,378 | 6,206 | 335 | 5.7% | ‐172 | ‐2.7% | 6,558 | 1,953 | 1,953 | 1,953 | 1,953 | 1,953 | ‐3,919 | ‐66.7% | ‐4,253 | ‐68.5% | ‐4,605 | ‐70.2% |
| February | 5,149 | 5,832 | 5,305 | 156 | 3.0% | ‐527 | ‐9.0% | 6,037 | 1,851 | 1,851 | 1,780 | 1,710 | 1,946 | ‐3,440 to ‐3,298 | ‐66.8% to ‐64.0% | ‐3,596 to ‐3,454 | ‐67.8% to ‐65.1% | ‐4,327 to ‐4,186 | ‐71.7% to ‐69.3% |
| March | 5,929 | 6,432 | 2,992 | ‐2,937 | ‐49.5% | ‐3,440 | ‐53.5% | 6,530 | 2,439 | 2,306 | 2,278 | 2,139 | 3,049 | ‐3,791 to ‐3,490 | ‐63.9% to ‐58.9% | ‐854 to ‐553 | ‐28.5% to ‐18.5% | ‐4,392 to ‐4,091 | ‐67.2% to ‐62.6% |
| April | 6,091 | 6,646 | 71 | ‐6,020 | ‐98.8% | ‐6,574 | ‐98.9% | 7,074 | 3,077 | 2,582 | 2,751 | 2,467 | 4,270 | ‐3,623 to ‐3,013 | ‐59.5% to ‐49.5% | 2,396 to 3,006 | 3367.4% to 4224.6% | ‐4,606 to ‐3,996 | ‐65.1% to ‐56.5% |
| May | 5,633 | 6,157 | 100 | ‐5,533 | ‐98.2% | ‐6,057 | ‐98.4% | 6,571 | 3,260 | 2,577 | 2,797 | 2,389 | 4,188 | ‐3,244 to ‐2,374 | ‐57.6% to ‐42.1% | 2,289 to 3,159 | 2283.3% to 3151.5% | ‐4,182 to ‐3,312 | ‐63.6% to ‐50.4% |
| June | 6,311 | 6,941 | 200 | ‐6,111 | ‐96.8% | ‐6,741 | ‐97.1% | 7,509 | 4,246 | 3,321 | 3,639 | 2,929 | 4,703 | ‐3,382 to ‐2,065 | ‐53.6% to ‐32.7% | 2,728 to 4,046 | 1362.7% to 2020.6% | ‐4,580 to ‐3,263 | ‐61.0% to ‐43.5% |
| July | 7,156 | 7,645 | 679 | ‐6,477 | ‐90.5% | ‐6,966 | ‐91.1% | ‐ | ‐ | ‐ | ‐ | ‐ | ‐ | ‐ | ‐ | ‐ | ‐ | ‐ | ‐ |
| August | 7,547 | 7,989 | 994 | ‐6,553 | ‐86.8% | ‐6,996 | ‐87.6% | ‐ | ‐ | ‐ | ‐ | ‐ | ‐ | ‐ | ‐ | ‐ | ‐ | ‐ | ‐ |
| September | 6,349 | 6,814 | 943 | ‐5,406 | ‐85.1% | ‐5,871 | ‐86.2% | ‐ | ‐ | ‐ | ‐ | ‐ | ‐ | ‐ | ‐ | ‐ | ‐ | ‐ | ‐ |
| October | 6,002 | 6,376 | 1,318 | ‐4,684 | ‐78.0% | ‐5,058 | ‐79.3% | ‐ | ‐ | ‐ | ‐ | ‐ | ‐ | ‐ | ‐ | ‐ | ‐ | ‐ | ‐ |
| November | 5,733 | 6,153 | 1,305 | ‐4,428 | ‐77.2% | ‐4,847 | ‐78.8% | ‐ | ‐ | ‐ | ‐ | ‐ | ‐ | ‐ | ‐ | ‐ | ‐ | ‐ | ‐ |
| December | 6,340 | 6,882 | 1,848 | ‐4,493 | ‐70.9% | ‐5,035 | ‐73.2% | ‐ | ‐ | ‐ | ‐ | ‐ | ‐ | ‐ | ‐ | ‐ | ‐ | ‐ | ‐ |
| 1Q | 16,949 | 18,642 | 14,503 | ‐2,446 | ‐14.4% | ‐4,139 | ‐22.2% | 19,125 | 6,243 | 6,110 | 6,010 | 5,801 | 6,947 | ‐11,149 to ‐10,706 | ‐65.8% to ‐63.2% | ‐8,703 to ‐8,260 | ‐60.0% to ‐57.0% | ‐13,324 to ‐12,882 | ‐69.7% to ‐67.4% |
| 2Q | 18,035 | 19,745 | 372 | ‐17,663 | ‐97.9% | ‐19,373 | ‐98.1% | 21,154 | 10,583 | 8,480 | 9,187 | 7,785 | 13,160 | ‐10,250 to ‐7,452 | ‐56.8% to ‐41.3% | 7,414 to 10,211 | 1994.9% to 2747.7% | ‐13,368 to ‐10,571 | ‐63.2% to ‐50.0% |
| 3Q | 21,052 | 22,448 | 2,616 | ‐18,436 | ‐87.6% | ‐19,833 | ‐88.3% | ‐ | ‐ | ‐ | ‐ | ‐ | ‐ | ‐ | ‐ | ‐ | ‐ | ‐ | ‐ |
| 4Q | 18,075 | 19,411 | 4,471 | ‐13,604 | ‐75.3% | ‐14,940 | ‐77.0% | ‐ | ‐ | ‐ | ‐ | ‐ | ‐ | ‐ | ‐ | ‐ | ‐ | ‐ | ‐ |
| Total | 74,111 | 80,246 | 21,961 | ‐52,150 | ‐70.4% | ‐58,284 | ‐72.6% | 40,278 | 16,826 | 14,590 | 15,197 | 13,586 | 20,107 | ‐21,398 to ‐18,158 | ‐61.2% to ‐51.9% | ‐1,289 to 1,951 | ‐8.7% to 13.1% | ‐26,692 to ‐23,452 | ‐66.3% to ‐58.2% |
| Passenger Number (thousand) ‐ Africa Domestic | |||||||||||||||||||
| Year | 2019 | 2020 | 2021 | ||||||||||||||||
| Month | Actual | Baseline | Estimated | Compared to 2019 | Compared to Baseline | Baseline | Scenario 1 | Scenario 1a | Scenario 2 | Scenario 2a | Reference | Compared to 2019 | Compared to 2020 | Compared to Baseline | |||||
| a | b | c | c‐a | c/a‐1 | c‐b | c/b‐1 | d | e | ‐ | e‐a | e/a‐1 | e‐c | e/a‐1 | e‐d | e/d‐1 | ||||
| January | 3,408 | 3,580 | 3,367 | ‐41 | ‐1.2% | ‐213 | ‐6.0% | 3,788 | 1,561 | 1,561 | 1,561 | 1,561 | 1,561 | ‐1,847 | ‐54.2% | ‐1,807 | ‐53.7% | ‐2,227 | ‐58.8% |
| February | 3,141 | 3,371 | 3,122 | ‐19 | ‐0.6% | ‐250 | ‐7.4% | 3,518 | 1,561 | 1,561 | 1,519 | 1,478 | 1,958 | ‐1,663 to ‐1,580 | ‐53.0% to ‐50.3% | ‐1,644 to ‐1,561 | ‐52.7% to ‐50.0% | ‐2,041 to ‐1,958 | ‐58.0% to ‐55.6% |
| March | 3,498 | 3,646 | 2,032 | ‐1,466 | ‐41.9% | ‐1,614 | ‐44.3% | 3,753 | 1,864 | 1,768 | 1,734 | 1,683 | 2,556 | ‐1,814 to ‐1,634 | ‐51.9% to ‐46.7% | ‐349 to ‐168 | ‐17.2% to ‐8.3% | ‐2,070 to ‐1,889 | ‐55.1% to ‐50.3% |
| April | 3,401 | 3,469 | 32 | ‐3,370 | ‐99.1% | ‐3,437 | ‐99.1% | 3,490 | 1,907 | 1,672 | 1,716 | 1,622 | 2,347 | ‐1,779 to ‐1,495 | ‐52.3% to ‐43.9% | 1,591 to 1,875 | 5041.4% to 5943.1% | ‐1,868 to ‐1,583 | ‐53.5% to ‐45.4% |
| May | 3,020 | 3,134 | 30 | ‐2,990 | ‐99.0% | ‐3,104 | ‐99.1% | 3,183 | 1,885 | 1,606 | 1,664 | 1,520 | 2,179 | ‐1,500 to ‐1,135 | ‐49.7% to ‐37.6% | 1,490 to 1,856 | 5028.3% to 6261.9% | ‐1,663 to ‐1,298 | ‐52.3% to ‐40.8% |
| June | 3,187 | 3,308 | 152 | ‐3,036 | ‐95.2% | ‐3,157 | ‐95.4% | 3,387 | 2,197 | 1,871 | 1,938 | 1,700 | 2,275 | ‐1,487 to ‐990 | ‐46.7% to ‐31.1% | 1,549 to 2,046 | 1021.8% to 1349.7% | ‐1,686 to ‐1,189 | ‐49.8% to ‐35.1% |
| July | 3,508 | 3,588 | 438 | ‐3,070 | ‐87.5% | ‐3,150 | ‐87.8% | ‐ | ‐ | ‐ | ‐ | ‐ | ‐ | ‐ | ‐ | ‐ | ‐ | ‐ | ‐ |
| August | 3,620 | 3,629 | 759 | ‐2,861 | ‐79.0% | ‐2,870 | ‐79.1% | ‐ | ‐ | ‐ | ‐ | ‐ | ‐ | ‐ | ‐ | ‐ | ‐ | ‐ | ‐ |
| September | 3,469 | 3,531 | 781 | ‐2,688 | ‐77.5% | ‐2,750 | ‐77.9% | ‐ | ‐ | ‐ | ‐ | ‐ | ‐ | ‐ | ‐ | ‐ | ‐ | ‐ | ‐ |
| October | 3,517 | 3,622 | 1,238 | ‐2,278 | ‐64.8% | ‐2,384 | ‐65.8% | ‐ | ‐ | ‐ | ‐ | ‐ | ‐ | ‐ | ‐ | ‐ | ‐ | ‐ | ‐ |
| November | 3,490 | 3,652 | 1,317 | ‐2,173 | ‐62.3% | ‐2,335 | ‐63.9% | ‐ | ‐ | ‐ | ‐ | ‐ | ‐ | ‐ | ‐ | ‐ | ‐ | ‐ | ‐ |
| December | 3,758 | 4,016 | 1,995 | ‐1,763 | ‐46.9% | ‐2,021 | ‐50.3% | ‐ | ‐ | ‐ | ‐ | ‐ | ‐ | ‐ | ‐ | ‐ | ‐ | ‐ | ‐ |
| 1Q | 10,047 | 10,598 | 8,521 | ‐1,526 | ‐15.2% | ‐2,077 | ‐19.6% | 11,060 | 4,986 | 4,889 | 4,814 | 4,722 | 6,075 | ‐5,325 to ‐5,061 | ‐53.0% to ‐50.4% | ‐3,799 to ‐3,535 | ‐44.6% to ‐41.5% | ‐6,338 to ‐6,074 | ‐57.3% to ‐54.9% |
| 2Q | 9,609 | 9,911 | 213 | ‐9,396 | ‐97.8% | ‐9,698 | ‐97.9% | 10,060 | 5,989 | 5,149 | 5,317 | 4,842 | 6,801 | ‐4,767 to ‐3,619 | ‐49.6% to ‐37.7% | 4,629 to 5,777 | 2176.0% to 2715.1% | ‐5,217 to ‐4,070 | ‐51.9% to ‐40.5% |
| 3Q | 10,597 | 10,748 | 1,978 | ‐8,619 | ‐81.3% | ‐8,770 | ‐81.6% | ‐ | ‐ | ‐ | ‐ | ‐ | ‐ | ‐ | ‐ | ‐ | ‐ | ‐ | ‐ |
| 4Q | 10,764 | 11,290 | 4,550 | ‐6,214 | ‐57.7% | ‐6,740 | ‐59.7% | ‐ | ‐ | ‐ | ‐ | ‐ | ‐ | ‐ | ‐ | ‐ | ‐ | ‐ | ‐ |
| Total | 41,016 | 42,547 | 15,261 | ‐25,755 | ‐62.8% | ‐27,286 | ‐64.1% | 21,119 | 10,975 | 10,037 | 10,131 | 9,564 | 12,875 | ‐10,092 to ‐8,681 | ‐51.3% to ‐44.2% | 830 to 2,241 | 9.5% to 25.7% | ‐11,555 to ‐10,145 | ‐54.7% to ‐48.0% |
Passenger number
Passenger revenue
| Passenger revenue (USD, million) ‐ Africa International | |||||||||||||||||||
| Year | 2019 | 2020 | 2021 | ||||||||||||||||
| Month | Actual | Baseline | Estimated | Compared to 2019 | Compared to Baseline | Baseline | Scenario 1 | Scenario 1a | Scenario 2 | Scenario 2a | Reference | Compared to 2019 | Compared to 2020 | Compared to Baseline | |||||
| a | b | c | c‐a | c/a‐1 | c‐b | c/b‐1 | d | e | ‐ | e‐a | e/a‐1 | e‐c | e/a‐1 | e‐d | e/d‐1 | ||||
| January | 1,290 | 1,391 | 1,373 | 83 | 6.5% | ‐18 | ‐1.3% | 1,419 | 427 | 427 | 427 | 427 | 427 | ‐863 | ‐66.9% | ‐946 | ‐68.9% | ‐992 | ‐69.9% |
| February | 1,125 | 1,267 | 1,158 | 34 | 3.0% | ‐109 | ‐8.6% | 1,297 | 405 | 405 | 389 | 374 | 425 | ‐751 to ‐720 | ‐66.8% to ‐64.0% | ‐785 to ‐754 | ‐67.7% to ‐65.1% | ‐923 to ‐892 | ‐71.2% to ‐68.8% |
| March | 1,288 | 1,390 | 670 | ‐618 | ‐48.0% | ‐720 | ‐51.8% | 1,399 | 533 | 503 | 498 | 467 | 664 | ‐820 to ‐755 | ‐63.7% to ‐58.6% | ‐203 to ‐137 | ‐30.3% to ‐20.5% | ‐932 to ‐867 | ‐66.6% to ‐61.9% |
| April | 1,303 | 1,406 | 19 | ‐1,284 | ‐98.6% | ‐1,387 | ‐98.7% | 1,485 | 670 | 563 | 600 | 538 | 926 | ‐764 to ‐632 | ‐58.7% to ‐48.5% | 520 to 652 | 2790.5% to 3499.9% | ‐947 to ‐815 | ‐63.8% to ‐54.9% |
| May | 1,215 | 1,321 | 25 | ‐1,191 | ‐98.0% | ‐1,296 | ‐98.1% | 1,398 | 709 | 562 | 609 | 521 | 908 | ‐694 to ‐506 | ‐57.1% to ‐41.6% | 496 to 685 | 2007.7% to 2769.0% | ‐877 to ‐689 | ‐62.7% to ‐49.3% |
| June | 1,355 | 1,469 | 49 | ‐1,307 | ‐96.4% | ‐1,420 | ‐96.7% | 1,573 | 922 | 723 | 791 | 638 | 1,021 | ‐717 to ‐434 | ‐52.9% to ‐32.0% | 589 to 873 | 1208.9% to 1790.4% | ‐935 to ‐652 | ‐59.4% to ‐41.4% |
| July | 1,539 | 1,624 | 148 | ‐1,391 | ‐90.4% | ‐1,476 | ‐90.9% | ‐ | ‐ | ‐ | ‐ | ‐ | ‐ | ‐ | ‐ | ‐ | ‐ | ‐ | ‐ |
| August | 1,620 | 1,696 | 217 | ‐1,403 | ‐86.6% | ‐1,479 | ‐87.2% | ‐ | ‐ | ‐ | ‐ | ‐ | ‐ | ‐ | ‐ | ‐ | ‐ | ‐ | ‐ |
| September | 1,359 | 1,446 | 215 | ‐1,144 | ‐84.2% | ‐1,231 | ‐85.1% | ‐ | ‐ | ‐ | ‐ | ‐ | ‐ | ‐ | ‐ | ‐ | ‐ | ‐ | ‐ |
| October | 1,296 | 1,363 | 295 | ‐1,001 | ‐77.2% | ‐1,068 | ‐78.3% | ‐ | ‐ | ‐ | ‐ | ‐ | ‐ | ‐ | ‐ | ‐ | ‐ | ‐ | ‐ |
| November | 1,258 | 1,333 | 287 | ‐971 | ‐77.2% | ‐1,047 | ‐78.5% | ‐ | ‐ | ‐ | ‐ | ‐ | ‐ | ‐ | ‐ | ‐ | ‐ | ‐ | ‐ |
| December | 1,397 | 1,503 | 404 | ‐993 | ‐71.1% | ‐1,099 | ‐73.1% | ‐ | ‐ | ‐ | ‐ | ‐ | ‐ | ‐ | ‐ | ‐ | ‐ | ‐ | ‐ |
| 1Q | 3,702 | 4,049 | 3,202 | ‐501 | ‐13.5% | ‐847 | ‐20.9% | 4,115 | 1,364 | 1,335 | 1,313 | 1,268 | 1,516 | ‐2,434 to ‐2,338 | ‐65.8% to ‐63.2% | ‐1,934 to ‐1,837 | ‐60.4% to ‐57.4% | ‐2,848 to ‐2,751 | ‐69.2% to ‐66.9% |
| 2Q | 3,873 | 4,196 | 92 | ‐3,781 | ‐97.6% | ‐4,104 | ‐97.8% | 4,457 | 2,301 | 1,848 | 2,000 | 1,697 | 2,854 | ‐2,176 to ‐1,572 | ‐56.2% to ‐40.6% | 1,605 to 2,209 | 1743.1% to 2398.8% | ‐2,759 to ‐2,155 | ‐61.9% to ‐48.4% |
| 3Q | 4,518 | 4,767 | 580 | ‐3,938 | ‐87.2% | ‐4,187 | ‐87.8% | ‐ | ‐ | ‐ | ‐ | ‐ | ‐ | ‐ | ‐ | ‐ | ‐ | ‐ | ‐ |
| 4Q | 3,950 | 4,199 | 986 | ‐2,964 | ‐75.0% | ‐3,213 | ‐76.5% | ‐ | ‐ | ‐ | ‐ | ‐ | ‐ | ‐ | ‐ | ‐ | ‐ | ‐ | ‐ |
| Total | 16,044 | 17,210 | 4,860 | ‐11,184 | ‐69.7% | ‐12,351 | ‐71.8% | 8,572 | 3,665 | 3,183 | 3,314 | 2,965 | 4,370 | ‐4,610 to ‐3,910 | ‐60.9% to ‐51.6% | ‐328 to 372 | ‐10.0% to 11.3% | ‐5,607 to ‐4,906 | ‐65.4% to ‐57.2% |
| Passenger revenue (USD, million) ‐ Africa Domestic | |||||||||||||||||||
| Year | 2019 | 2020 | 2021 | ||||||||||||||||
| Month | Actual | Baseline | Estimated | Compared to 2019 | Compared to Baseline | Baseline | Scenario 1 | Scenario 1a | Scenario 2 | Scenario 2a | Reference | Compared to 2019 | Compared to 2020 | Compared to Baseline | |||||
| a | b | c | c‐a | c/a‐1 | c‐b | c/b‐1 | d | e | ‐ | e‐a | e/a‐1 | e‐c | e/a‐1 | e‐d | e/d‐1 | ||||
| January | 309 | 325 | 305 | ‐4 | ‐1.2% | ‐19 | ‐6.0% | 343 | 141 | 141 | 141 | 141 | 141 | ‐167 | ‐54.2% | ‐164 | ‐53.7% | ‐202 | ‐58.8% |
| February | 285 | 306 | 283 | ‐2 | ‐0.6% | ‐23 | ‐7.4% | 319 | 141 | 141 | 138 | 134 | 178 | ‐151 to ‐143 | ‐53.0% to ‐50.3% | ‐149 to ‐141 | ‐52.7% to ‐50.0% | ‐185 to ‐177 | ‐58.0% to ‐55.6% |
| March | 317 | 331 | 184 | ‐133 | ‐41.9% | ‐146 | ‐44.3% | 340 | 169 | 160 | 157 | 153 | 232 | ‐164 to ‐148 | ‐51.9% to ‐46.7% | ‐32 to ‐15 | ‐17.2% to ‐8.3% | ‐188 to ‐171 | ‐55.1% to ‐50.3% |
| April | 308 | 314 | 3 | ‐305 | ‐99.1% | ‐312 | ‐99.1% | 316 | 173 | 152 | 156 | 147 | 213 | ‐161 to ‐136 | ‐52.3% to ‐43.9% | 144 to 170 | 5041.4% to 5943.1% | ‐169 to ‐144 | ‐53.5% to ‐45.4% |
| May | 274 | 284 | 3 | ‐271 | ‐99.0% | ‐281 | ‐99.1% | 289 | 171 | 146 | 151 | 138 | 198 | ‐136 to ‐103 | ‐49.7% to ‐37.6% | 135 to 168 | 5028.3% to 6261.9% | ‐151 to ‐118 | ‐52.3% to ‐40.8% |
| June | 289 | 300 | 14 | ‐275 | ‐95.2% | ‐286 | ‐95.4% | 307 | 199 | 170 | 176 | 154 | 206 | ‐135 to ‐90 | ‐46.7% to ‐31.1% | 140 to 185 | 1021.8% to 1349.7% | ‐153 to ‐108 | ‐49.8% to ‐35.1% |
| July | 318 | 325 | 40 | ‐278 | ‐87.5% | ‐286 | ‐87.8% | ‐ | ‐ | ‐ | ‐ | ‐ | ‐ | ‐ | ‐ | ‐ | ‐ | ‐ | ‐ |
| August | 328 | 329 | 69 | ‐259 | ‐79.0% | ‐260 | ‐79.1% | ‐ | ‐ | ‐ | ‐ | ‐ | ‐ | ‐ | ‐ | ‐ | ‐ | ‐ | ‐ |
| September | 314 | 320 | 71 | ‐244 | ‐77.5% | ‐249 | ‐77.9% | ‐ | ‐ | ‐ | ‐ | ‐ | ‐ | ‐ | ‐ | ‐ | ‐ | ‐ | ‐ |
| October | 319 | 328 | 112 | ‐207 | ‐64.8% | ‐216 | ‐65.8% | ‐ | ‐ | ‐ | ‐ | ‐ | ‐ | ‐ | ‐ | ‐ | ‐ | ‐ | ‐ |
| November | 316 | 331 | 119 | ‐197 | ‐62.3% | ‐212 | ‐63.9% | ‐ | ‐ | ‐ | ‐ | ‐ | ‐ | ‐ | ‐ | ‐ | ‐ | ‐ | ‐ |
| December | 341 | 364 | 181 | ‐160 | ‐46.9% | ‐183 | ‐50.3% | ‐ | ‐ | ‐ | ‐ | ‐ | ‐ | ‐ | ‐ | ‐ | ‐ | ‐ | ‐ |
| 1Q | 911 | 961 | 772 | ‐138 | ‐15.2% | ‐188 | ‐19.6% | 1,003 | 452 | 443 | 436 | 428 | 551 | ‐483 to ‐459 | ‐53.0% to ‐50.4% | ‐344 to ‐320 | ‐44.6% to ‐41.5% | ‐575 to ‐551 | ‐57.3% to ‐54.9% |
| 2Q | 871 | 898 | 19 | ‐852 | ‐97.8% | ‐879 | ‐97.9% | 912 | 543 | 467 | 482 | 439 | 616 | ‐432 to ‐328 | ‐49.6% to ‐37.7% | 420 to 524 | 2176.0% to 2715.1% | ‐473 to ‐369 | ‐51.9% to ‐40.5% |
| 3Q | 961 | 974 | 179 | ‐781 | ‐81.3% | ‐795 | ‐81.6% | ‐ | ‐ | ‐ | ‐ | ‐ | ‐ | ‐ | ‐ | ‐ | ‐ | ‐ | ‐ |
| 4Q | 976 | 1,023 | 412 | ‐563 | ‐57.7% | ‐611 | ‐59.7% | ‐ | ‐ | ‐ | ‐ | ‐ | ‐ | ‐ | ‐ | ‐ | ‐ | ‐ | ‐ |
| Total | 3,718 | 3,857 | 1,383 | ‐2,335 | ‐62.8% | ‐2,473 | ‐64.1% | 1,914 | 995 | 910 | 918 | 867 | 1,167 | ‐915 to ‐787 | ‐51.3% to ‐44.2% | 75 to 203 | 9.5% to 25.7% | ‐1,047 to ‐920 | ‐54.7% to ‐48.0% |
| Compared to 2019 | Seat capacity (%) | Passenger number (thousand) | Passenger revenue (USD, million) | |||||||||
| Total | International | Domestic | Total | International | Domestic | Total | International | Domestic | ||||
| 1Q 2020 | ‐25.1% | ‐25.9% | ‐24.7% | ‐140,680 | ‐34.5% | ‐40,003 | ‐32.7% | ‐100,677 | ‐35.3% | ‐16,257 | ‐7,891 | ‐8,366 |
| 2Q 2020 | ‐68.5% | ‐90.8% | ‐58.8% | ‐317,235 | ‐77.1% | ‐117,222 | ‐96.4% | ‐200,013 | ‐69.0% | ‐38,970 | ‐24,855 | ‐14,114 |
| 3Q 2020 | ‐49.3% | ‐87.6% | ‐32.8% | ‐258,676 | ‐59.3% | ‐120,561 | ‐94.6% | ‐138,115 | ‐44.7% | ‐34,739 | ‐25,585 | ‐9,154 |
| 4Q 2020 | ‐37.4% | ‐85.8% | ‐16.2% | ‐204,867 | ‐48.3% | ‐117,220 | ‐93.8% | ‐87,648 | ‐29.3% | ‐30,488 | ‐25,068 | ‐5,420 |
| Total 2020 | ‐45.1% | ‐72.7% | ‐33.0% | ‐921,458 | ‐54.8% | ‐395,005 | ‐79.6% | ‐526,453 | ‐44.5% | ‐120,453 | ‐83,400 | ‐37,053 |
| 1Q 2021 | ‐46.4% to ‐45.5% | ‐85.0% to ‐84.2% | ‐29.2% to ‐28.3% | ‐233,622 to ‐225,333 | ‐57.3% to ‐55.2% | ‐113,407 to ‐111,903 | ‐92.6% to ‐91.4% | ‐120,215 to ‐113,430 | ‐42.1% to ‐39.7% | ‐32,266 to ‐31,386 | ‐23,937 to ‐23,586 | ‐8,329 to ‐7,800 |
| 2Q 2021 | ‐42.1% to ‐35.4% | ‐76.0% to ‐64.1% | ‐27.5% to ‐22.9% | ‐222,097 to ‐176,314 | ‐54.0% to ‐42.8% | ‐106,324 to ‐90,720 | ‐87.4% to ‐74.6% | ‐115,774 to ‐85,594 | ‐39.9% to ‐29.5% | ‐30,221 to ‐24,340 | ‐22,289 to ‐18,739 | ‐7,932 to ‐5,601 |
| 3Q 2021 | ‐ | ‐ | ‐ | ‐ | ‐ | ‐ | ‐ | ‐ | ‐ | ‐ | ‐ | ‐ |
| 4Q 2021 | ‐ | ‐ | ‐ | ‐ | ‐ | ‐ | ‐ | ‐ | ‐ | ‐ | ‐ | ‐ |
| Total 1Q/2Q 2021 | ‐44.3% to ‐40.5% | ‐80.5% to ‐74.1% | ‐28.3% to ‐25.6% | ‐455,720 to ‐401,647 | ‐55.6% to ‐49.0% | ‐219,731 to ‐202,623 | ‐90.0% to ‐83.0% | ‐235,989 to ‐199,024 | ‐41.0% to ‐34.6% | ‐62,487 to ‐55,726 | ‐46,225 to ‐42,325 | ‐16,261 to ‐13,401 |
Seat capacity
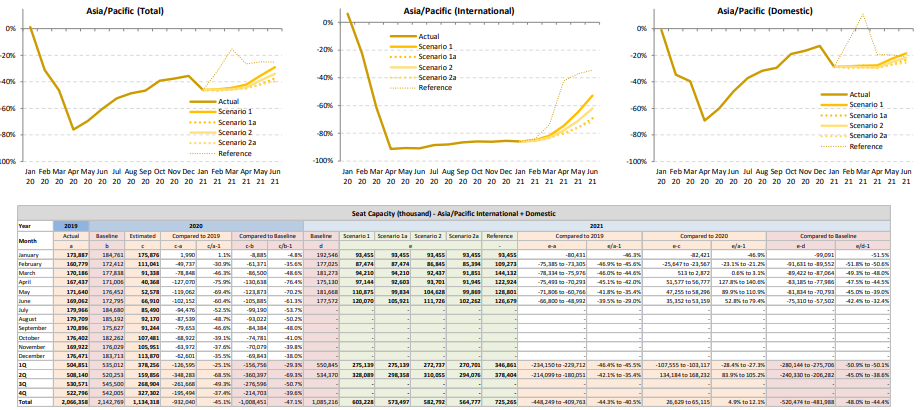
Seat capacity
| Seat Capacity (thousand) ‐ Asia/Pacific International | |||||||||||||||||||
| Year | 2019 | 2020 | 2021 | ||||||||||||||||
| Month | Actual | Baseline | Estimated | Compared to 2019 | Compared to Baseline | Baseline | Scenario 1 | Scenario 1a | Scenario 2 | Scenario 2a | Reference | Compared to 2019 | Compared to 2020 | Compared to Baseline | |||||
| a | b | c | c‐a | c/a‐1 | c‐b | c/b‐1 | d | e | ‐ | e‐a | e/a‐1 | e‐c | e/a‐1 | e‐d | e/d‐1 | ||||
| January | 53,178 | 57,177 | 56,416 | 3,238 | 6.1% | ‐761 | ‐1.3% | 59,993 | 7,500 | 7,500 | 7,500 | 7,500 | 7,500 | ‐45,678 | ‐85.9% | ‐48,916 | ‐86.7% | ‐52,493 | ‐87.5% |
| February | 49,160 | 52,616 | 38,157 | ‐11,003 | ‐22.4% | ‐14,459 | ‐27.5% | 54,323 | 7,380 | 7,380 | 7,213 | 7,092 | 7,898 | ‐42,067 to ‐41,780 | ‐85.6% to ‐85.0% | ‐31,064 to ‐30,777 | ‐81.4% to ‐80.7% | ‐47,230 to ‐46,943 | ‐86.9% to ‐86.4% |
| March | 52,782 | 55,037 | 20,383 | ‐32,399 | ‐61.4% | ‐34,654 | ‐63.0% | 56,939 | 9,636 | 9,636 | 8,980 | 8,663 | 13,743 | ‐44,119 to ‐43,146 | ‐83.6% to ‐81.7% | ‐11,720 to ‐10,747 | ‐57.5% to ‐52.7% | ‐48,276 to ‐47,302 | ‐84.8% to ‐83.1% |
| April | 51,335 | 52,996 | 4,531 | ‐46,804 | ‐91.2% | ‐48,465 | ‐91.5% | 54,593 | 13,060 | 10,194 | 11,412 | 10,361 | 29,600 | ‐41,140 to ‐38,275 | ‐80.1% to ‐74.6% | 5,664 to 8,529 | 125.0% to 188.3% | ‐44,399 to ‐41,533 | ‐81.3% to ‐76.1% |
| May | 52,030 | 54,297 | 4,918 | ‐47,112 | ‐90.5% | ‐49,380 | ‐90.9% | 56,289 | 18,382 | 12,481 | 15,147 | 12,702 | 32,719 | ‐39,549 to ‐33,647 | ‐76.0% to ‐64.7% | 7,563 to 13,464 | 153.8% to 273.8% | ‐43,808 to ‐37,907 | ‐77.8% to ‐67.3% |
| June | 51,160 | 53,047 | 4,720 | ‐46,440 | ‐90.8% | ‐48,326 | ‐91.1% | 54,880 | 24,094 | 15,764 | 19,386 | 14,465 | 33,577 | ‐36,696 to ‐27,067 | ‐71.7% to ‐52.9% | 9,745 to 19,373 | 206.4% to 410.4% | ‐40,415 to ‐30,786 | ‐73.6% to ‐56.1% |
| July | 54,007 | 55,893 | 6,277 | ‐47,730 | ‐88.4% | ‐49,616 | ‐88.8% | ‐ | ‐ | ‐ | ‐ | ‐ | ‐ | ‐ | ‐ | ‐ | ‐ | ‐ | ‐ |
| August | 54,403 | 57,005 | 6,575 | ‐47,828 | ‐87.9% | ‐50,431 | ‐88.5% | ‐ | ‐ | ‐ | ‐ | ‐ | ‐ | ‐ | ‐ | ‐ | ‐ | ‐ | ‐ |
| September | 51,417 | 52,963 | 6,976 | ‐44,441 | ‐86.4% | ‐45,987 | ‐86.8% | ‐ | ‐ | ‐ | ‐ | ‐ | ‐ | ‐ | ‐ | ‐ | ‐ | ‐ | ‐ |
| October | 52,753 | 55,530 | 7,441 | ‐45,312 | ‐85.9% | ‐48,089 | ‐86.6% | ‐ | ‐ | ‐ | ‐ | ‐ | ‐ | ‐ | ‐ | ‐ | ‐ | ‐ | ‐ |
| November | 51,509 | 54,649 | 7,151 | ‐44,358 | ‐86.1% | ‐47,497 | ‐86.9% | ‐ | ‐ | ‐ | ‐ | ‐ | ‐ | ‐ | ‐ | ‐ | ‐ | ‐ | ‐ |
| December | 54,864 | 58,266 | 8,034 | ‐46,830 | ‐85.4% | ‐50,232 | ‐86.2% | ‐ | ‐ | ‐ | ‐ | ‐ | ‐ | ‐ | ‐ | ‐ | ‐ | ‐ | ‐ |
| 1Q | 155,120 | 164,829 | 114,956 | ‐40,164 | ‐25.9% | ‐49,874 | ‐30.3% | 171,254 | 24,516 | 24,516 | 23,694 | 23,255 | 29,142 | ‐131,864 to ‐130,603 | ‐85.0% to ‐84.2% | ‐91,700 to ‐90,439 | ‐79.8% to ‐78.7% | ‐147,999 to ‐146,738 | ‐86.4% to ‐85.7% |
| 2Q | 154,525 | 160,340 | 14,169 | ‐140,356 | ‐90.8% | ‐146,172 | ‐91.2% | 165,762 | 55,536 | 38,439 | 45,945 | 37,529 | 95,895 | ‐117,385 to ‐98,989 | ‐76.0% to ‐64.1% | 22,971 to 41,367 | 162.1% to 292.0% | ‐128,622 to ‐110,226 | ‐77.6% to ‐66.5% |
| 3Q | 159,828 | 165,862 | 19,828 | ‐139,999 | ‐87.6% | ‐146,033 | ‐88.0% | ‐ | ‐ | ‐ | ‐ | ‐ | ‐ | ‐ | ‐ | ‐ | ‐ | ‐ | ‐ |
| 4Q | 159,126 | 168,445 | 22,627 | ‐136,500 | ‐85.8% | ‐145,818 | ‐86.6% | ‐ | ‐ | ‐ | ‐ | ‐ | ‐ | ‐ | ‐ | ‐ | ‐ | ‐ | ‐ |
| Total | 628,598 | 659,477 | 171,580 | ‐457,019 | ‐72.7% | ‐487,897 | ‐74.0% | 337,016 | 80,052 | 62,955 | 69,639 | 60,784 | 125,037 | ‐249,249 to ‐229,592 | ‐80.5% to ‐74.1% | ‐68,729 to ‐49,072 | ‐53.2% to ‐38.0% | ‐276,621 to ‐256,964 | ‐82.1% to ‐76.2% |
| Seat Capacity (thousand) ‐ Asia/Pacific Domestic | |||||||||||||||||||
| Year | 2019 | 2020 | 2021 | ||||||||||||||||
| Month | Actual | Baseline | Estimated | Compared to 2019 | Compared to Baseline | Baseline | Scenario 1 | Scenario 1a | Scenario 2 | Scenario 2a | Reference | Compared to 2019 | Compared to 2020 | Compared to Baseline | |||||
| a | b | c | c‐a | c/a‐1 | c‐b | c/b‐1 | d | e | ‐ | e‐a | e/a‐1 | e‐c | e/a‐1 | e‐d | e/d‐1 | ||||
| January | 120,709 | 127,584 | 119,460 | ‐1,248 | ‐1.0% | ‐8,124 | ‐6.4% | 132,553 | 85,955 | 85,955 | 85,955 | 85,955 | 85,955 | ‐34,754 | ‐28.8% | ‐33,505 | ‐28.0% | ‐46,598 | ‐35.2% |
| February | 111,619 | 119,796 | 72,885 | ‐38,734 | ‐34.7% | ‐46,912 | ‐39.2% | 122,703 | 80,094 | 80,094 | 79,632 | 78,302 | 101,375 | ‐33,317 to ‐31,525 | ‐29.8% to ‐28.2% | 5,417 to 7,209 | 7.4% to 9.9% | ‐44,401 to ‐42,609 | ‐36.2% to ‐34.7% |
| March | 117,404 | 122,802 | 70,955 | ‐46,449 | ‐39.6% | ‐51,847 | ‐42.2% | 124,335 | 84,574 | 84,574 | 83,456 | 83,189 | 130,389 | ‐34,215 to ‐32,830 | ‐29.1% to ‐28.0% | 12,234 to 13,619 | 17.2% to 19.2% | ‐41,146 to ‐39,761 | ‐33.1% to ‐32.0% |
| April | 116,103 | 118,010 | 35,837 | ‐80,266 | ‐69.1% | ‐82,173 | ‐69.6% | 120,537 | 84,084 | 82,409 | 82,289 | 81,583 | 93,325 | ‐34,519 to ‐32,019 | ‐29.7% to ‐27.6% | 45,746 to 48,247 | 127.7% to 134.6% | ‐38,954 to ‐36,453 | ‐32.3% to ‐30.2% |
| May | 119,611 | 122,154 | 47,661 | ‐71,950 | ‐60.2% | ‐74,493 | ‐61.0% | 125,379 | 92,493 | 87,353 | 89,481 | 87,167 | 96,082 | ‐32,444 to ‐27,118 | ‐27.1% to ‐22.7% | 39,506 to 44,832 | 82.9% to 94.1% | ‐38,213 to ‐32,887 | ‐30.5% to ‐26.2% |
| June | 117,902 | 119,749 | 62,190 | ‐55,712 | ‐47.3% | ‐57,559 | ‐48.1% | 122,692 | 95,976 | 90,157 | 92,340 | 87,797 | 93,102 | ‐30,104 to ‐21,926 | ‐25.5% to ‐18.6% | 25,607 to 33,786 | 41.2% to 54.3% | ‐34,895 to ‐26,716 | ‐28.4% to ‐21.8% |
| July | 125,958 | 128,787 | 79,213 | ‐46,745 | ‐37.1% | ‐49,574 | ‐38.5% | ‐ | ‐ | ‐ | ‐ | ‐ | ‐ | ‐ | ‐ | ‐ | ‐ | ‐ | ‐ |
| August | 125,307 | 128,187 | 85,595 | ‐39,711 | ‐31.7% | ‐42,591 | ‐33.2% | ‐ | ‐ | ‐ | ‐ | ‐ | ‐ | ‐ | ‐ | ‐ | ‐ | ‐ | ‐ |
| September | 119,479 | 122,664 | 84,267 | ‐35,212 | ‐29.5% | ‐38,397 | ‐31.3% | ‐ | ‐ | ‐ | ‐ | ‐ | ‐ | ‐ | ‐ | ‐ | ‐ | ‐ | ‐ |
| October | 123,649 | 126,732 | 100,039 | ‐23,610 | ‐19.1% | ‐26,693 | ‐21.1% | ‐ | ‐ | ‐ | ‐ | ‐ | ‐ | ‐ | ‐ | ‐ | ‐ | ‐ | ‐ |
| November | 118,413 | 121,381 | 98,799 | ‐19,614 | ‐16.6% | ‐22,581 | ‐18.6% | ‐ | ‐ | ‐ | ‐ | ‐ | ‐ | ‐ | ‐ | ‐ | ‐ | ‐ | ‐ |
| December | 121,607 | 125,447 | 105,836 | ‐15,771 | ‐13.0% | ‐19,611 | ‐15.6% | ‐ | ‐ | ‐ | ‐ | ‐ | ‐ | ‐ | ‐ | ‐ | ‐ | ‐ | ‐ |
| 1Q | 349,732 | 370,182 | 263,300 | ‐86,432 | ‐24.7% | ‐106,882 | ‐28.9% | 379,591 | 250,622 | 250,622 | 249,043 | 247,445 | 317,719 | ‐102,286 to ‐99,109 | ‐29.2% to ‐28.3% | ‐15,855 to ‐12,678 | ‐6.0% to ‐4.8% | ‐132,145 to ‐128,968 | ‐34.8% to ‐34.0% |
| 2Q | 353,615 | 359,913 | 145,687 | ‐207,928 | ‐58.8% | ‐214,225 | ‐59.5% | 368,608 | 272,553 | 259,919 | 264,110 | 256,547 | 282,509 | ‐97,068 to ‐81,062 | ‐27.5% to ‐22.9% | 110,860 to 126,865 | 76.1% to 87.1% | ‐112,061 to ‐96,056 | ‐30.4% to ‐26.1% |
| 370,744 | 379,638 | 249,075 | ‐121,668 | ‐32.8% | ‐130,563 | ‐34.4% | ‐ | ‐ | ‐ | ‐ | ‐ | ‐ | ‐ | ‐ | ‐ | ‐ | ‐ | ‐ | |
| 4Q | 363,669 | 373,559 | 304,675 | ‐58,994 | ‐16.2% | ‐68,885 | ‐18.4% | ‐ | ‐ | ‐ | ‐ | ‐ | ‐ | ‐ | ‐ | ‐ | ‐ | ‐ | ‐ |
| Total | 1,437,760 | 1,483,292 | 962,738 | ‐475,022 | ‐33.0% | ‐520,554 | ‐35.1% | 748,199 | 523,175 | 510,542 | 513,153 | 503,993 | 600,228 | ‐199,354 to ‐180,172 | ‐28.3% to ‐25.6% | 95,005 to 114,188 | 23.2% to 27.9% | ‐244,207 to ‐225,024 | ‐32.6% to ‐30.1% |
Passenger number
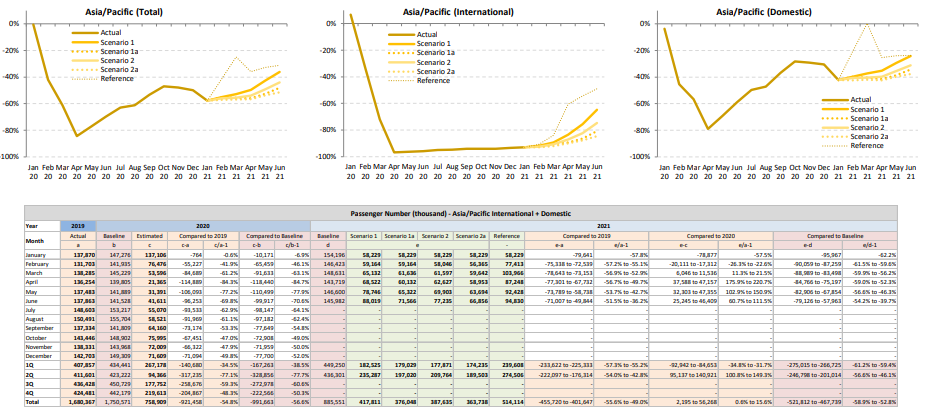
Passenger number
| Passenger Number (thousand) ‐ Asia/Pacific International | |||||||||||||||||||
| Year | 2019 | 2020 | 2021 | ||||||||||||||||
| Month | Actual | Baseline | Estimated | Compared to 2019 | Compared to Baseline | Baseline | Scenario 1 | Scenario 1a | Scenario 2 | Scenario 2a | Reference | Compared to 2019 | Compared to 2020 | Compared to Baseline | |||||
| a | b | c | c‐a | c/a‐1 | c‐b | c/b‐1 | d | e | ‐ | e‐a | e/a‐1 | e‐c | e/a‐1 | e‐d | e/d‐1 | ||||
| January | 42,372 | 45,737 | 45,192 | 2,820 | 6.7% | ‐546 | ‐1.2% | 48,117 | 2,973 | 2,973 | 2,973 | 2,973 | 2,973 | ‐39,398 | ‐93.0% | ‐42,218 | ‐93.4% | ‐45,144 | ‐93.8% |
| February | 38,698 | 41,573 | 25,691 | ‐13,007 | ‐33.6% | ‐15,882 | ‐38.2% | 43,040 | 3,148 | 3,148 | 2,934 | 2,744 | 3,564 | ‐35,954 to ‐35,550 | ‐92.9% to ‐91.9% | ‐22,947 to ‐22,543 | ‐89.3% to ‐87.7% | ‐40,296 to ‐39,892 | ‐93.6% to ‐92.7% |
| March | 41,378 | 43,296 | 11,563 | ‐29,816 | ‐72.1% | ‐31,734 | ‐73.3% | 44,909 | 4,424 | 3,985 | 3,820 | 3,323 | 6,643 | ‐38,055 to ‐36,955 | ‐92.0% to ‐89.3% | ‐8,239 to ‐7,139 | ‐71.3% to ‐61.7% | ‐41,585 to ‐40,485 | ‐92.6% to ‐90.1% |
| April | 41,000 | 42,478 | 1,342 | ‐39,658 | ‐96.7% | ‐41,136 | ‐96.8% | 43,865 | 6,817 | 4,366 | 5,308 | 4,127 | 16,171 | ‐36,873 to ‐34,183 | ‐89.9% to ‐83.4% | 2,785 to 5,475 | 207.5% to 408.0% | ‐39,738 to ‐37,048 | ‐90.6% to ‐84.5% |
| May | 39,963 | 41,839 | 1,457 | ‐38,506 | ‐96.4% | ‐40,382 | ‐96.5% | 43,476 | 9,789 | 5,423 | 7,040 | 4,925 | 18,203 | ‐35,039 to ‐30,175 | ‐87.7% to ‐75.5% | 3,468 to 8,332 | 238.0% to 571.8% | ‐38,552 to ‐33,687 | ‐88.7% to ‐77.5% |
| June | 40,683 | 42,329 | 1,626 | ‐39,057 | ‐96.0% | ‐40,703 | ‐96.2% | 43,899 | 14,321 | 7,795 | 10,264 | 6,272 | 20,771 | ‐34,412 to ‐26,362 | ‐84.6% to ‐64.8% | 4,645 to 12,695 | 285.6% to 780.6% | ‐37,627 to ‐29,578 | ‐85.7% to ‐67.4% |
| July | 43,780 | 45,477 | 2,218 | ‐41,562 | ‐94.9% | ‐43,259 | ‐95.1% | ‐ | ‐ | ‐ | ‐ | ‐ | ‐ | ‐ | ‐ | ‐ | ‐ | ‐ | ‐ |
| August | 44,296 | 46,589 | 2,331 | ‐41,965 | ‐94.7% | ‐44,258 | ‐95.0% | ‐ | ‐ | ‐ | ‐ | ‐ | ‐ | ‐ | ‐ | ‐ | ‐ | ‐ | ‐ |
| September | 39,365 | 40,698 | 2,331 | ‐37,034 | ‐94.1% | ‐38,367 | ‐94.3% | ‐ | ‐ | ‐ | ‐ | ‐ | ‐ | ‐ | ‐ | ‐ | ‐ | ‐ | ‐ |
| October | 40,850 | 43,162 | 2,440 | ‐38,410 | ‐94.0% | ‐40,723 | ‐94.3% | ‐ | ‐ | ‐ | ‐ | ‐ | ‐ | ‐ | ‐ | ‐ | ‐ | ‐ | ‐ |
| November | 40,110 | 42,716 | 2,391 | ‐37,719 | ‐94.0% | ‐40,325 | ‐94.4% | ‐ | ‐ | ‐ | ‐ | ‐ | ‐ | ‐ | ‐ | ‐ | ‐ | ‐ | ‐ |
| December | 43,970 | 46,875 | 2,880 | ‐41,090 | ‐93.5% | ‐43,995 | ‐93.9% | ‐ | ‐ | ‐ | ‐ | ‐ | ‐ | ‐ | ‐ | ‐ | ‐ | ‐ | ‐ |
| 1Q | 122,448 | 130,606 | 82,445 | ‐40,003 | ‐32.7% | ‐48,161 | ‐36.9% | 136,066 | 10,545 | 10,106 | 9,726 | 9,040 | 13,181 | ‐113,407 to ‐111,903 | ‐92.6% to ‐91.4% | ‐73,405 to ‐71,900 | ‐89.0% to ‐87.2% | ‐127,026 to ‐125,521 | ‐93.4% to ‐92.3% |
| 2Q | 121,647 | 126,647 | 4,425 | ‐117,222 | ‐96.4% | ‐122,221 | ‐96.5% | 131,240 | 30,927 | 17,584 | 22,612 | 15,323 | 55,146 | ‐106,324 to ‐90,720 | ‐87.4% to ‐74.6% | 10,898 to 26,501 | 246.2% to 598.8% | ‐115,917 to ‐100,313 | ‐88.3% to ‐76.4% |
| 3Q | 127,441 | 132,763 | 6,879 | ‐120,561 | ‐94.6% | ‐125,884 | ‐94.8% | ‐ | ‐ | ‐ | ‐ | ‐ | ‐ | ‐ | ‐ | ‐ | ‐ | ‐ | ‐ |
| 4Q | 124,930 | 132,753 | 7,711 | ‐117,220 | ‐93.8% | ‐125,042 | ‐94.2% | ‐ | ‐ | ‐ | ‐ | ‐ | ‐ | ‐ | ‐ | ‐ | ‐ | ‐ | ‐ |
| Total | 496,466 | 522,769 | 101,461 | ‐395,005 | ‐79.6% | ‐421,308 | ‐80.6% | 267,306 | 41,472 | 27,690 | 32,338 | 24,364 | 68,327 | ‐219,731 to ‐202,623 | ‐90.0% to ‐83.0% | ‐62,507 to ‐45,399 | ‐72.0% to ‐52.3% | ‐242,943 to ‐225,834 | ‐90.9% to ‐84.5% |
| Passenger Number (thousand) ‐ Asia/Pacific Domestic | |||||||||||||||||||
| Year | 2019 | 2020 | 2021 | ||||||||||||||||
| Month | Actual | Baseline | Estimated | Compared to 2019 | Compared to Baseline | Baseline | Scenario 1 | Scenario 1a | Scenario 2 | Scenario 2a | Reference | Compared to 2019 | Compared to 2020 | Compared to Baseline | |||||
| a | b | c | c‐a | c/a‐1 | c‐b | c/b‐1 | d | e | ‐ | e‐a | e/a‐1 | e‐c | e/a‐1 | e‐d | e/d‐1 | ||||
| January | 95,498 | 101,539 | 91,914 | ‐3,584 | ‐3.8% | ‐9,625 | ‐9.5% | 106,078 | 55,255 | 55,255 | 55,255 | 55,255 | 55,255 | ‐40,243 | ‐42.1% | ‐36,659 | ‐39.9% | ‐50,823 | ‐47.9% |
| February | 93,005 | 100,363 | 50,785 | ‐42,220 | ‐45.4% | ‐49,577 | ‐49.4% | 103,383 | 56,016 | 56,016 | 55,113 | 53,621 | 73,849 | ‐39,384 to ‐36,989 | ‐42.3% to ‐39.8% | 2,836 to 5,231 | 5.6% to 10.3% | ‐49,762 to ‐47,367 | ‐48.1% to ‐45.8% |
| March | 96,906 | 101,933 | 42,033 | ‐54,873 | ‐56.6% | ‐59,900 | ‐58.8% | 103,722 | 60,708 | 57,651 | 57,777 | 56,318 | 97,323 | ‐40,588 to ‐36,198 | ‐41.9% to ‐37.4% | 14,285 to 18,675 | 34.0% to 44.4% | ‐47,403 to ‐43,013 | ‐45.7% to ‐41.5% |
| April | 95,254 | 97,326 | 20,023 | ‐75,231 | ‐79.0% | ‐77,303 | ‐79.4% | 99,854 | 61,705 | 55,766 | 57,319 | 54,826 | 71,077 | ‐40,428 to ‐33,549 | ‐42.4% to ‐35.2% | 34,803 to 41,682 | 173.8% to 208.2% | ‐45,028 to ‐38,149 | ‐45.1% to ‐38.2% |
| May | 97,520 | 100,050 | 29,934 | ‐67,586 | ‐69.3% | ‐70,116 | ‐70.1% | 103,124 | 68,957 | 59,899 | 62,863 | 58,769 | 74,225 | ‐38,751 to ‐28,563 | ‐39.7% to ‐29.3% | 28,836 to 39,023 | 96.3% to 130.4% | ‐44,355 to ‐34,167 | ‐43.0% to ‐33.1% |
| June | 97,180 | 99,199 | 39,984 | ‐57,196 | ‐58.9% | ‐59,215 | ‐59.7% | 102,083 | 73,698 | 63,770 | 66,971 | 60,584 | 74,058 | ‐36,595 to ‐23,482 | ‐37.7% to ‐24.2% | 20,600 to 33,714 | 51.5% to 84.3% | ‐41,499 to ‐28,385 | ‐40.7% to ‐27.8% |
| July | 104,823 | 107,740 | 52,852 | ‐51,971 | ‐49.6% | ‐54,888 | ‐50.9% | ‐ | ‐ | ‐ | ‐ | ‐ | ‐ | ‐ | ‐ | ‐ | ‐ | ‐ | ‐ |
| August | 106,195 | 109,115 | 56,191 | ‐50,004 | ‐47.1% | ‐52,924 | ‐48.5% | ‐ | ‐ | ‐ | ‐ | ‐ | ‐ | ‐ | ‐ | ‐ | ‐ | ‐ | ‐ |
| September | 97,970 | 101,111 | 61,829 | ‐36,140 | ‐36.9% | ‐39,282 | ‐38.8% | ‐ | ‐ | ‐ | ‐ | ‐ | ‐ | ‐ | ‐ | ‐ | ‐ | ‐ | ‐ |
| October | 102,596 | 105,740 | 73,555 | ‐29,041 | ‐28.3% | ‐32,185 | ‐30.4% | ‐ | ‐ | ‐ | ‐ | ‐ | ‐ | ‐ | ‐ | ‐ | ‐ | ‐ | ‐ |
| November | 98,221 | 101,252 | 69,618 | ‐28,603 | ‐29.1% | ‐31,634 | ‐31.2% | ‐ | ‐ | ‐ | ‐ | ‐ | ‐ | ‐ | ‐ | ‐ | ‐ | ‐ | ‐ |
| December | 98,733 | 102,434 | 68,730 | ‐30,003 | ‐30.4% | ‐33,705 | ‐32.9% | ‐ | ‐ | ‐ | ‐ | ‐ | ‐ | ‐ | ‐ | ‐ | ‐ | ‐ | ‐ |
| 1Q | 285,410 | 303,835 | 184,732 | ‐100,677 | ‐35.3% | ‐119,102 | ‐39.2% | 313,184 | 171,980 | 168,922 | 168,145 | 165,195 | 226,427 | ‐120,215 to ‐113,430 | ‐42.1% to ‐39.7% | ‐19,538 to ‐12,753 | ‐10.6% to ‐6.9% | ‐147,989 to ‐141,204 | ‐47.3% to ‐45.1% |
| 2Q | 289,954 | 296,575 | 89,941 | ‐200,013 | ‐69.0% | ‐206,635 | ‐69.7% | 305,061 | 204,360 | 179,436 | 187,152 | 174,180 | 219,360 | ‐115,774 to ‐85,594 | ‐39.9% to ‐29.5% | 84,239 to 114,419 | 93.7% to 127.2% | ‐130,881 to ‐100,701 | ‐42.9% to ‐33.0% |
| 3Q | 308,988 | 317,966 | 170,872 | ‐138,115 | ‐44.7% | ‐147,094 | ‐46.3% | ‐ | ‐ | ‐ | ‐ | ‐ | ‐ | ‐ | ‐ | ‐ | ‐ | ‐ | ‐ |
| 4Q | 299,550 | 309,427 | 211,903 | ‐87,648 | ‐29.3% | ‐97,524 | ‐31.5% | ‐ | ‐ | ‐ | ‐ | ‐ | ‐ | ‐ | ‐ | ‐ | ‐ | ‐ | ‐ |
| Total | 1,183,901 | 1,227,803 | 657,448 | ‐526,453 | ‐44.5% | ‐570,354 | ‐46.5% | 618,244 | 376,339 | 348,358 | 355,297 | 339,375 | 445,787 | ‐235,989 to ‐199,024 | ‐41.0% to ‐34.6% | 64,702 to 101,666 | 23.6% to 37.0% | ‐278,870 to ‐241,905 | ‐45.1% to ‐39.1% |
Passenger revenue
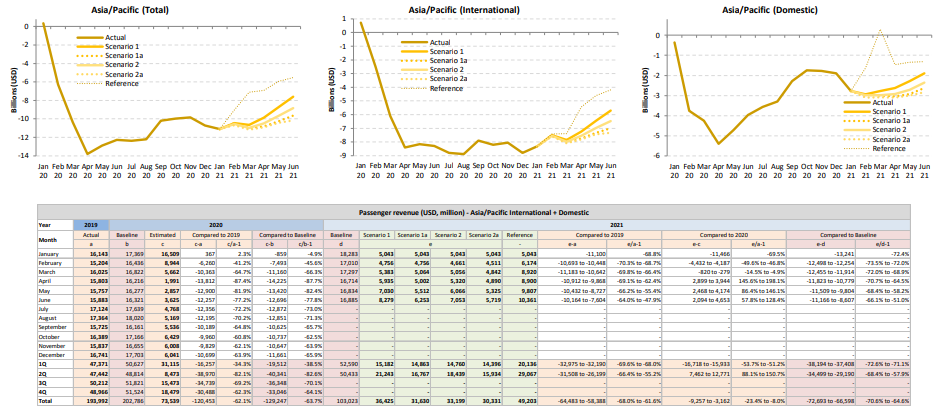
Passenger revenue
| Passenger revenue (USD, million) ‐ Asia/Pacific International | |||||||||||||||||||
| Year | 2019 | 2020 | 2021 | ||||||||||||||||
| Month | Actual | Baseline | Estimated | Compared to 2019 | Compared to Baseline | Baseline | Scenario 1 | Scenario 1a | Scenario 2 | Scenario 2a | Reference | Compared to 2019 | Compared to 2020 | Compared to Baseline | |||||
| a | b | c | c‐a | c/a‐1 | c‐b | c/b‐1 | d | e | ‐ | e‐a | e/a‐1 | e‐c | e/a‐1 | e‐d | e/d‐1 | ||||
| January | 9,018 | 9,778 | 9,744 | 726 | 8.0% | ‐34 | ‐0.3% | 10,303 | 698 | 698 | 698 | 698 | 698 | ‐8,320 | ‐92.3% | ‐9,046 | ‐92.8% | ‐9,605 | ‐93.2% |
| February | 8,209 | 8,877 | 5,701 | ‐2,508 | ‐30.6% | ‐3,176 | ‐35.8% | 9,185 | 739 | 739 | 689 | 644 | 836 | ‐7,565 to ‐7,471 | ‐92.2% to ‐91.0% | ‐5,057 to ‐4,962 | ‐88.7% to ‐87.0% | ‐8,541 to ‐8,446 | ‐93.0% to ‐92.0% |
| March | 8,830 | 9,243 | 2,721 | ‐6,109 | ‐69.2% | ‐6,522 | ‐70.6% | 9,545 | 1,035 | 932 | 894 | 779 | 1,544 | ‐8,051 to ‐7,795 | ‐91.2% to ‐88.3% | ‐1,943 to ‐1,686 | ‐71.4% to ‐62.0% | ‐8,766 to ‐8,510 | ‐91.8% to ‐89.2% |
| April | 8,704 | 8,993 | 298 | ‐8,405 | ‐96.6% | ‐8,695 | ‐96.7% | 9,301 | 1,584 | 1,019 | 1,237 | 963 | 3,658 | ‐7,740 to ‐7,119 | ‐88.9% to ‐81.8% | 665 to 1,286 | 223.3% to 431.5% | ‐8,338 to ‐7,717 | ‐89.6% to ‐83.0% |
| May | 8,493 | 8,864 | 326 | ‐8,167 | ‐96.2% | ‐8,538 | ‐96.3% | 9,196 | 2,257 | 1,262 | 1,631 | 1,146 | 4,108 | ‐7,347 to ‐6,236 | ‐86.5% to ‐73.4% | 820 to 1,931 | 251.7% to 592.8% | ‐8,050 to ‐6,939 | ‐87.5% to ‐75.5% |
| June | 8,656 | 8,976 | 373 | ‐8,283 | ‐95.7% | ‐8,603 | ‐95.8% | 9,319 | 3,272 | 1,804 | 2,362 | 1,454 | 4,679 | ‐7,202 to ‐5,384 | ‐83.2% to ‐62.2% | 1,081 to 2,899 | 290.0% to 777.5% | ‐7,865 to ‐6,047 | ‐84.4% to ‐64.9% |
| July | 9,302 | 9,644 | 510 | ‐8,792 | ‐94.5% | ‐9,134 | ‐94.7% | ‐ | ‐ | ‐ | ‐ | ‐ | ‐ | ‐ | ‐ | ‐ | ‐ | ‐ | ‐ |
| August | 9,441 | 9,923 | 550 | ‐8,891 | ‐94.2% | ‐9,372 | ‐94.5% | ‐ | ‐ | ‐ | ‐ | ‐ | ‐ | ‐ | ‐ | ‐ | ‐ | ‐ | ‐ |
| September | 8,448 | 8,696 | 546 | ‐7,902 | ‐93.5% | ‐8,150 | ‐93.7% | ‐ | ‐ | ‐ | ‐ | ‐ | ‐ | ‐ | ‐ | ‐ | ‐ | ‐ | ‐ |
| October | 8,781 | 9,295 | 570 | ‐8,211 | ‐93.5% | ‐8,725 | ‐93.9% | ‐ | ‐ | ‐ | ‐ | ‐ | ‐ | ‐ | ‐ | ‐ | ‐ | ‐ | ‐ |
| November | 8,618 | 9,206 | 561 | ‐8,057 | ‐93.5% | ‐8,645 | ‐93.9% | ‐ | ‐ | ‐ | ‐ | ‐ | ‐ | ‐ | ‐ | ‐ | ‐ | ‐ | ‐ |
| December | 9,475 | 10,148 | 676 | ‐8,800 | ‐92.9% | ‐9,472 | ‐93.3% | ‐ | ‐ | ‐ | ‐ | ‐ | ‐ | ‐ | ‐ | ‐ | ‐ | ‐ | ‐ |
| 1Q | 26,058 | 27,897 | 18,167 | ‐7,891 | ‐30.3% | ‐9,731 | ‐34.9% | 29,033 | 2,472 | 2,369 | 2,281 | 2,121 | 3,077 | ‐23,937 to ‐23,586 | ‐91.9% to ‐90.5% | ‐16,046 to ‐15,695 | ‐88.3% to ‐86.4% | ‐26,912 to ‐26,561 | ‐92.7% to ‐91.5% |
| 2Q | 25,852 | 26,832 | 997 | ‐24,855 | ‐96.1% | ‐25,836 | ‐96.3% | 27,816 | 7,113 | 4,086 | 5,230 | 3,563 | 12,445 | ‐22,289 to ‐18,739 | ‐86.2% to ‐72.5% | 2,567 to 6,117 | 257.5% to 613.7% | ‐24,252 to ‐20,702 | ‐87.2% to ‐74.4% |
| 3Q | 27,191 | 28,263 | 1,606 | ‐25,585 | ‐94.1% | ‐26,657 | ‐94.3% | ‐ | ‐ | ‐ | ‐ | ‐ | ‐ | ‐ | ‐ | ‐ | ‐ | ‐ | ‐ |
| 4Q | 26,875 | 28,648 | 1,806 | ‐25,068 | ‐93.3% | ‐26,842 | ‐93.7% | ‐ | ‐ | ‐ | ‐ | ‐ | ‐ | ‐ | ‐ | ‐ | ‐ | ‐ | ‐ |
| Total | 105,975 | 111,641 | 22,576 | ‐83,400 | ‐78.7% | ‐89,065 | ‐79.8% | 56,849 | 9,585 | 6,455 | 7,511 | 5,685 | 15,522 | ‐46,225 to ‐42,325 | ‐89.0% to ‐81.5% | ‐13,479 to ‐9,578 | ‐70.3% to ‐50.0% | ‐51,164 to ‐47,263 | ‐90.0% to ‐83.1% |
| Passenger revenue (USD, million) ‐ Asia/Pacific Domestic | |||||||||||||||||||
| Year | 2019 | 2020 | 2021 | ||||||||||||||||
| Month | Actual | Baseline | Estimated | Compared to 2019 | Compared to Baseline | Baseline | Scenario 1 | Scenario 1a | Scenario 2 | Scenario 2a | Reference | Compared to 2019 | Compared to 2020 | Compared to Baseline | |||||
| a | b | c | c‐a | c/a‐1 | c‐b | c/b‐1 | d | e | ‐ | e‐a | e/a‐1 | e‐c | e/a‐1 | e‐d | e/d‐1 | ||||
| January | 7,124 | 7,591 | 6,765 | ‐359 | ‐5.0% | ‐826 | ‐10.9% | 7,980 | 4,344 | 4,344 | 4,344 | 4,344 | 4,344 | ‐2,780 | ‐39.0% | ‐2,420 | ‐35.8% | ‐3,636 | ‐45.6% |
| February | 6,995 | 7,560 | 3,242 | ‐3,752 | ‐53.6% | ‐4,317 | ‐57.1% | 7,825 | 4,403 | 4,403 | 4,333 | 4,217 | 5,768 | ‐2,777 to ‐2,591 | ‐39.7% to ‐37.0% | 975 to 1,161 | 30.1% to 35.8% | ‐3,607 to ‐3,422 | ‐46.1% to ‐43.7% |
| March | 7,195 | 7,579 | 2,941 | ‐4,254 | ‐59.1% | ‐4,638 | ‐61.2% | 7,752 | 4,766 | 4,526 | 4,537 | 4,423 | 7,528 | ‐2,772 to ‐2,429 | ‐38.5% to ‐33.8% | 1,482 to 1,825 | 50.4% to 62.1% | ‐3,329 to ‐2,986 | ‐42.9% to ‐38.5% |
| April | 7,099 | 7,223 | 1,693 | ‐5,406 | ‐76.2% | ‐5,530 | ‐76.6% | 7,412 | 4,839 | 4,377 | 4,499 | 4,304 | 5,559 | ‐2,795 to ‐2,260 | ‐39.4% to ‐31.8% | 2,611 to 3,147 | 154.2% to 185.9% | ‐3,109 to ‐2,573 | ‐41.9% to ‐34.7% |
| May | 7,264 | 7,413 | 2,531 | ‐4,733 | ‐65.2% | ‐4,882 | ‐65.9% | 7,639 | 5,396 | 4,698 | 4,925 | 4,609 | 5,807 | ‐2,656 to ‐1,868 | ‐36.6% to ‐25.7% | 2,078 to 2,865 | 82.1% to 113.2% | ‐3,030 to ‐2,243 | ‐39.7% to ‐29.4% |
| June | 7,227 | 7,345 | 3,252 | ‐3,974 | ‐55.0% | ‐4,093 | ‐55.7% | 7,566 | 5,754 | 4,991 | 5,236 | 4,746 | 5,797 | ‐2,481 to ‐1,473 | ‐34.3% to ‐20.4% | 1,493 to 2,501 | 45.9% to 76.9% | ‐2,821 to ‐1,813 | ‐37.3% to ‐24.0% |
| July | 7,822 | 7,995 | 4,258 | ‐3,564 | ‐45.6% | ‐3,737 | ‐46.7% | ‐ | ‐ | ‐ | ‐ | ‐ | ‐ | ‐ | ‐ | ‐ | ‐ | ‐ | ‐ |
| August | 7,922 | 8,098 | 4,619 | ‐3,303 | ‐41.7% | ‐3,479 | ‐43.0% | ‐ | ‐ | ‐ | ‐ | ‐ | ‐ | ‐ | ‐ | ‐ | ‐ | ‐ | ‐ |
| September | 7,277 | 7,465 | 4,990 | ‐2,287 | ‐31.4% | ‐2,475 | ‐33.2% | ‐ | ‐ | ‐ | ‐ | ‐ | ‐ | ‐ | ‐ | ‐ | ‐ | ‐ | ‐ |
| October | 7,608 | 7,872 | 5,859 | ‐1,748 | ‐23.0% | ‐2,013 | ‐25.6% | ‐ | ‐ | ‐ | ‐ | ‐ | ‐ | ‐ | ‐ | ‐ | ‐ | ‐ | ‐ |
| November | 7,219 | 7,450 | 5,447 | ‐1,772 | ‐24.5% | ‐2,002 | ‐26.9% | ‐ | ‐ | ‐ | ‐ | ‐ | ‐ | ‐ | ‐ | ‐ | ‐ | ‐ | ‐ |
| December | 7,265 | 7,555 | 5,366 | ‐1,899 | ‐26.1% | ‐2,189 | ‐29.0% | ‐ | ‐ | ‐ | ‐ | ‐ | ‐ | ‐ | ‐ | ‐ | ‐ | ‐ | ‐ |
| 1Q | 21,313 | 22,730 | 12,948 | ‐8,366 | ‐39.3% | ‐9,782 | ‐43.0% | 23,557 | 13,514 | 13,274 | 13,215 | 12,985 | 17,640 | ‐8,329 to ‐7,800 | ‐39.1% to ‐36.6% | 37 to 566 | 0.3% to 4.4% | ‐10,572 to ‐10,043 | ‐44.9% to ‐42.6% |
| 2Q | 21,590 | 21,981 | 7,476 | ‐14,114 | ‐65.4% | ‐14,505 | ‐66.0% | 22,618 | 15,989 | 14,066 | 14,660 | 13,658 | 17,163 | ‐7,932 to ‐5,601 | ‐36.7% to ‐25.9% | 6,182 to 8,513 | 82.7% to 113.9% | ‐8,960 to ‐6,628 | ‐39.6% to ‐29.3% |
| 3Q | 23,021 | 23,558 | 13,867 | ‐9,154 | ‐39.8% | ‐9,691 | ‐41.1% | ‐ | ‐ | ‐ | ‐ | ‐ | ‐ | ‐ | ‐ | ‐ | ‐ | ‐ | ‐ |
| 4Q | 22,092 | 22,876 | 16,672 | ‐5,420 | ‐24.5% | ‐6,204 | ‐27.1% | ‐ | ‐ | ‐ | ‐ | ‐ | ‐ | ‐ | ‐ | ‐ | ‐ | ‐ | ‐ |
| Total | 88,016 | 91,145 | 50,963 | ‐37,053 | ‐42.1% | ‐40,182 | ‐44.1% | 46,175 | 29,503 | 27,340 | 27,875 | 26,642 | 34,803 | ‐16,261 to ‐13,401 | ‐37.9% to ‐31.2% | 6,218 to 9,079 | 30.4% to 44.5% | ‐19,532 to ‐16,672 | ‐42.3% to ‐36.1% |
| Compared to 2019 | Seat capacity (%) | Passenger number (thousand) | Passenger revenue (USD, million) | |||||||||
| Total | International | Domestic | Total | International | Domestic | Total | International | Domestic | ||||
| 1Q 2020 | ‐12.8% | ‐14.0% | ‐10.2% | ‐41,010 | ‐17.5% | ‐30,007 | ‐18.1% | ‐11,002 | ‐16.0% | ‐5,254 | ‐4,350 | ‐905 |
| 2Q 2020 | ‐90.1% | ‐93.3% | ‐80.9% | ‐291,112 | ‐94.2% | ‐223,363 | ‐96.8% | ‐67,749 | ‐86.4% | ‐36,388 | ‐30,818 | ‐5,570 |
| 3Q 2020 | ‐56.1% | ‐64.2% | ‐30.8% | ‐237,499 | ‐67.8% | ‐208,114 | ‐78.3% | ‐29,385 | ‐34.7% | ‐32,074 | ‐29,658 | ‐2,416 |
| 4Q 2020 | ‐64.3% | ‐72.8% | ‐41.9% | ‐199,727 | ‐75.2% | ‐163,060 | ‐84.4% | ‐36,667 | ‐50.6% | ‐26,347 | ‐23,332 | ‐3,015 |
| Total 2020 | ‐57.9% | ‐63.9% | ‐41.4% | ‐769,347 | ‐66.3% | ‐624,545 | ‐73.0% | ‐144,803 | ‐47.6% | ‐100,063 | ‐88,158 | ‐11,905 |
| 1Q 2021 | ‐70.0% to ‐68.7% | ‐77.2% to ‐75.8% | ‐53.3% to ‐52.2% | ‐182,454 to ‐178,211 | ‐77.8% to ‐76.0% | ‐141,618 to ‐138,549 | ‐85.4% to ‐83.5% | ‐40,836 to ‐39,661 | ‐59.6% to ‐57.8% | ‐23,945 to ‐23,386 | ‐20,587 to ‐20,126 | ‐3,357 to ‐3,261 |
| 2Q 2021 | ‐56.7% to ‐41.0% | ‐60.5% to ‐42.0% | ‐45.6% to ‐37.9% | ‐210,507 to ‐156,865 | ‐68.1% to ‐50.7% | ‐169,524 to ‐124,029 | ‐73.5% to ‐53.8% | ‐40,983 to ‐32,836 | ‐52.3% to ‐41.9% | ‐26,056 to ‐18,773 | ‐22,687 to ‐16,074 | ‐3,369 to ‐2,700 |
| 3Q 2021 | ‐ | ‐ | ‐ | ‐ | ‐ | ‐ | ‐ | ‐ | ‐ | ‐ | ‐ | ‐ |
| 4Q 2021 | ‐ | ‐ | ‐ | ‐ | ‐ | ‐ | ‐ | ‐ | ‐ | ‐ | ‐ | ‐ |
| Total 1Q/2Q 2021 | ‐62.6% to ‐53.3% | ‐67.7% to ‐56.5% | ‐49.3% to ‐44.7% | ‐392,961 to ‐335,076 | ‐72.3% to ‐61.6% | ‐311,142 to ‐262,578 | ‐78.5% to ‐66.2% | ‐81,819 to ‐72,497 | ‐55.7% to ‐49.3% | ‐50,001 to ‐42,160 | ‐43,274 to ‐36,199 | ‐6,727 to ‐5,960 |
Seat capacity
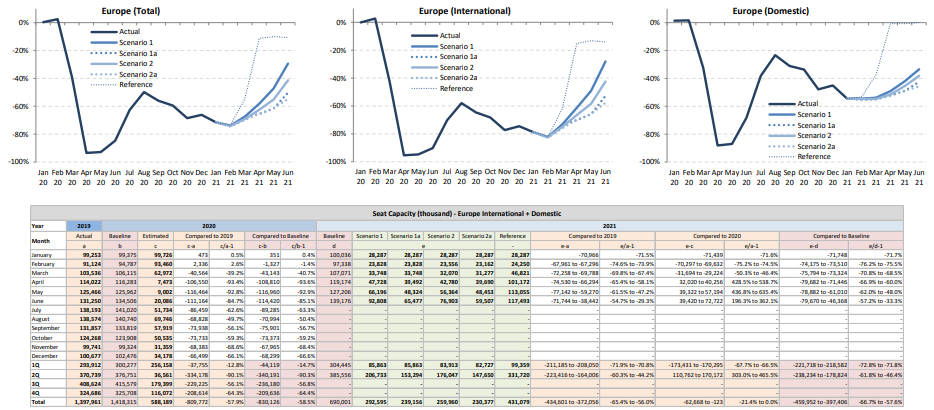
Seat capacity
| Seat Capacity (thousand) ‐ Europe International | |||||||||||||||||||
| Year | 2019 | 2020 | 2021 | ||||||||||||||||
| Month | Actual | Baseline | Estimated | Compared to 2019 | Compared to Baseline | Baseline | Scenario 1 | Scenario 1a | Scenario 2 | Scenario 2a | Reference | Compared to 2019 | Compared to 2020 | Compared to Baseline | |||||
| a | b | c | c‐a | c/a‐1 | c‐b | c/b‐1 | d | e | ‐ | e‐a | e/a‐1 | e‐c | e/a‐1 | e‐d | e/d‐1 | ||||
| January | 69,546 | 70,173 | 69,578 | 33 | 0.0% | ‐594 | ‐0.8% | 71,125 | 14,785 | 14,785 | 14,785 | 14,785 | 14,785 | ‐54,761 | ‐78.7% | ‐54,794 | ‐78.8% | ‐56,340 | ‐79.2% |
| February | 63,796 | 67,633 | 65,647 | 1,851 | 2.9% | ‐1,986 | ‐2.9% | 69,524 | 12,543 | 12,543 | 12,347 | 12,141 | 12,630 | ‐51,655 to ‐51,253 | ‐81.0% to ‐80.3% | ‐53,506 to ‐53,104 | ‐81.5% to ‐80.9% | ‐57,384 to ‐56,981 | ‐82.5% to ‐82.0% |
| March | 72,868 | 76,030 | 42,188 | ‐30,680 | ‐42.1% | ‐33,842 | ‐44.5% | 77,348 | 22,605 | 22,605 | 20,951 | 20,124 | 30,816 | ‐52,745 to ‐50,263 | ‐72.4% to ‐69.0% | ‐22,065 to ‐19,583 | ‐52.3% to ‐46.4% | ‐57,224 to ‐54,743 | ‐74.0% to ‐70.8% |
| April | 83,899 | 86,297 | 3,879 | ‐80,020 | ‐95.4% | ‐82,418 | ‐95.5% | 89,399 | 36,033 | 28,603 | 31,327 | 28,383 | 72,444 | ‐55,517 to ‐47,867 | ‐66.2% to ‐57.1% | 24,503 to 32,153 | 631.6% to 828.8% | ‐61,016 to ‐53,366 | ‐68.3% to ‐59.7% |
| May | 93,237 | 93,961 | 4,820 | ‐88,417 | ‐94.8% | ‐89,141 | ‐94.9% | 95,137 | 50,827 | 35,710 | 42,193 | 35,146 | 81,601 | ‐58,091 to ‐42,411 | ‐62.3% to ‐45.5% | 30,326 to 46,006 | 629.1% to 954.4% | ‐59,990 to ‐44,310 | ‐63.1% to ‐46.6% |
| June | 98,521 | 102,007 | 9,702 | ‐88,819 | ‐90.2% | ‐92,306 | ‐90.5% | 106,619 | 72,892 | 50,511 | 60,476 | 45,241 | 85,037 | ‐53,280 to ‐25,628 | ‐54.1% to ‐26.0% | 35,539 to 63,191 | 366.3% to 651.4% | ‐61,378 to ‐33,726 | ‐57.6% to ‐31.6% |
| July | 105,080 | 108,140 | 31,270 | ‐73,810 | ‐70.2% | ‐76,870 | ‐71.1% | ‐ | ‐ | ‐ | ‐ | ‐ | ‐ | ‐ | ‐ | ‐ | ‐ | ‐ | ‐ |
| August | 105,456 | 107,856 | 44,327 | ‐61,129 | ‐58.0% | ‐63,529 | ‐58.9% | ‐ | ‐ | ‐ | ‐ | ‐ | ‐ | ‐ | ‐ | ‐ | ‐ | ‐ | ‐ |
| September | 98,705 | 100,901 | 35,050 | ‐63,655 | ‐64.5% | ‐65,851 | ‐65.3% | ‐ | ‐ | ‐ | ‐ | ‐ | ‐ | ‐ | ‐ | ‐ | ‐ | ‐ | ‐ |
| October | 92,377 | 92,558 | 29,384 | ‐62,994 | ‐68.2% | ‐63,175 | ‐68.3% | ‐ | ‐ | ‐ | ‐ | ‐ | ‐ | ‐ | ‐ | ‐ | ‐ | ‐ | ‐ |
| November | 70,369 | 70,451 | 16,025 | ‐54,344 | ‐77.2% | ‐54,426 | ‐77.3% | ‐ | ‐ | ‐ | ‐ | ‐ | ‐ | ‐ | ‐ | ‐ | ‐ | ‐ | ‐ |
| December | 71,715 | 74,164 | 18,267 | ‐53,449 | ‐74.5% | ‐55,898 | ‐75.4% | ‐ | ‐ | ‐ | ‐ | ‐ | ‐ | ‐ | ‐ | ‐ | ‐ | ‐ | ‐ |
| 1Q | 206,210 | 213,835 | 177,414 | ‐28,796 | ‐14.0% | ‐36,422 | ‐17.0% | 217,997 | 49,933 | 49,933 | 48,083 | 47,049 | 58,231 | ‐159,160 to ‐156,277 | ‐77.2% to ‐75.8% | ‐130,364 to ‐127,480 | ‐73.5% to ‐71.9% | ‐170,948 to ‐168,064 | ‐78.4% to ‐77.1% |
| 2Q | 275,657 | 282,266 | 18,401 | ‐257,256 | ‐93.3% | ‐263,864 | ‐93.5% | 291,154 | 159,752 | 114,824 | 133,996 | 108,770 | 239,082 | ‐166,887 to ‐115,906 | ‐60.5% to ‐42.0% | 90,369 to 141,350 | 491.1% to 768.1% | ‐182,384 to ‐131,402 | ‐62.6% to ‐45.1% |
| 3Q | 309,241 | 316,897 | 110,647 | ‐198,594 | ‐64.2% | ‐206,250 | ‐65.1% | ‐ | ‐ | ‐ | ‐ | ‐ | ‐ | ‐ | ‐ | ‐ | ‐ | ‐ | ‐ |
| 4Q | 234,461 | 237,173 | 63,675 | ‐170,787 | ‐72.8% | ‐173,499 | ‐73.2% | ‐ | ‐ | ‐ | ‐ | ‐ | ‐ | ‐ | ‐ | ‐ | ‐ | ‐ | ‐ |
| Total | 1,025,570 | 1,050,171 | 370,136 | ‐655,433 | ‐63.9% | ‐680,035 | ‐64.8% | 509,151 | 209,685 | 164,757 | 182,079 | 155,819 | 297,313 | ‐326,048 to ‐272,182 | ‐67.7% to ‐56.5% | ‐39,996 to 13,870 | ‐20.4% to 7.1% | ‐353,332 to ‐299,466 | ‐69.4% to ‐58.8% |
| Seat Capacity (thousand) ‐ Europe Domestic | |||||||||||||||||||
| Year | 2019 | 2020 | 2021 | ||||||||||||||||
| Month | Actual | Baseline | Estimated | Compared to 2019 | Compared to Baseline | Baseline | Scenario 1 | Scenario 1a | Scenario 2 | Scenario 2a | Reference | Compared to 2019 | Compared to 2020 | Compared to Baseline | |||||
| a | b | c | c‐a | c/a‐1 | c‐b | c/b‐1 | d | e | ‐ | e‐a | e/a‐1 | e‐c | e/a‐1 | e‐d | e/d‐1 | ||||
| January | 29,708 | 29,203 | 30,148 | 440 | 1.5% | 945 | 3.2% | 28,911 | 13,502 | 13,502 | 13,502 | 13,502 | 13,502 | ‐16,205 | ‐54.5% | ‐16,645 | ‐55.2% | ‐15,408 | ‐53.3% |
| February | 27,328 | 27,154 | 27,813 | 485 | 1.8% | 659 | 2.4% | 27,814 | 13,128 | 13,128 | 12,934 | 12,717 | 13,191 | ‐14,610 to ‐14,200 | ‐53.5% to ‐52.0% | ‐15,096 to ‐14,686 | ‐54.3% to ‐52.8% | ‐15,096 to ‐14,686 | ‐54.3% to ‐52.8% |
| March | 30,667 | 30,085 | 20,783 | ‐9,884 | ‐32.2% | ‐9,301 | ‐30.9% | 29,723 | 15,295 | 15,295 | 14,886 | 14,778 | 20,768 | ‐15,890 to ‐15,372 | ‐51.8% to ‐50.1% | ‐6,006 to ‐5,488 | ‐28.9% to ‐26.4% | ‐14,945 to ‐14,427 | ‐50.3% to ‐48.5% |
| April | 30,123 | 29,986 | 3,593 | ‐26,530 | ‐88.1% | ‐26,393 | ‐88.0% | 29,776 | 16,440 | 15,546 | 15,661 | 15,350 | 30,285 | ‐14,773 to ‐13,683 | ‐49.0% to ‐45.4% | 11,757 to 12,847 | 327.2% to 357.5% | ‐14,425 to ‐13,336 | ‐48.4% to ‐44.8% |
| May | 32,229 | 32,001 | 4,181 | ‐28,047 | ‐87.0% | ‐27,820 | ‐86.9% | 32,069 | 19,938 | 17,646 | 18,555 | 17,516 | 32,224 | ‐14,712 to ‐12,291 | ‐45.6% to ‐38.1% | 13,335 to 15,756 | 318.9% to 376.8% | ‐14,553 to ‐12,132 | ‐45.4% to ‐37.8% |
| June | 32,730 | 32,499 | 10,385 | ‐22,345 | ‐68.3% | ‐22,114 | ‐68.0% | 32,558 | 22,692 | 20,067 | 21,258 | 18,835 | 32,839 | ‐13,895 to ‐10,038 | ‐42.5% to ‐30.7% | 8,450 to 12,308 | 81.4% to 118.5% | ‐13,723 to ‐9,865 | ‐42.1% to ‐30.3% |
| July | 33,114 | 32,880 | 20,465 | ‐12,649 | ‐38.2% | ‐12,415 | ‐37.8% | ‐ | ‐ | ‐ | ‐ | ‐ | ‐ | ‐ | ‐ | ‐ | ‐ | ‐ | ‐ |
| August | 33,118 | 32,884 | 25,419 | ‐7,699 | ‐23.2% | ‐7,465 | ‐22.7% | ‐ | ‐ | ‐ | ‐ | ‐ | ‐ | ‐ | ‐ | ‐ | ‐ | ‐ | ‐ |
| September | 33,152 | 32,918 | 22,869 | ‐10,283 | ‐31.0% | ‐10,049 | ‐30.5% | ‐ | ‐ | ‐ | ‐ | ‐ | ‐ | ‐ | ‐ | ‐ | ‐ | ‐ | ‐ |
| October | 31,891 | 31,349 | 21,152 | ‐10,739 | ‐33.7% | ‐10,198 | ‐32.5% | ‐ | ‐ | ‐ | ‐ | ‐ | ‐ | ‐ | ‐ | ‐ | ‐ | ‐ | ‐ |
| November | 29,373 | 28,874 | 15,334 | ‐14,038 | ‐47.8% | ‐13,539 | ‐46.9% | ‐ | ‐ | ‐ | ‐ | ‐ | ‐ | ‐ | ‐ | ‐ | ‐ | ‐ | ‐ |
| December | 28,961 | 28,312 | 15,911 | ‐13,050 | ‐45.1% | ‐12,401 | ‐43.8% | ‐ | ‐ | ‐ | ‐ | ‐ | ‐ | ‐ | ‐ | ‐ | ‐ | ‐ | ‐ |
| 1Q | 87,703 | 86,441 | 78,744 | ‐8,959 | ‐10.2% | ‐7,698 | ‐8.9% | 86,448 | 41,925 | 41,925 | 41,322 | 40,998 | 47,462 | ‐46,705 to ‐45,777 | ‐53.3% to ‐52.2% | ‐37,746 to ‐36,819 | ‐47.9% to ‐46.8% | ‐45,450 to ‐44,522 | ‐52.6% to ‐51.5% |
| 2Q | 95,081 | 94,486 | 18,159 | ‐76,922 | ‐80.9% | ‐76,327 | ‐80.8% | 94,403 | 59,070 | 53,259 | 55,474 | 51,701 | 95,348 | ‐43,380 to ‐36,011 | ‐45.6% to ‐37.9% | 33,542 to 40,911 | 184.7% to 225.3% | ‐42,701 to ‐35,333 | ‐45.2% to ‐37.4% |
| 3Q | 99,383 | 98,682 | 68,752 | ‐30,631 | ‐30.8% | ‐29,929 | ‐30.3% | ‐ | ‐ | ‐ | ‐ | ‐ | ‐ | ‐ | ‐ | ‐ | ‐ | ‐ | ‐ |
| 4Q | 90,225 | 88,535 | 52,397 | ‐37,828 | ‐41.9% | ‐36,138 | ‐40.8% | ‐ | ‐ | ‐ | ‐ | ‐ | ‐ | ‐ | ‐ | ‐ | ‐ | ‐ | ‐ |
| Total | 372,392 | 368,144 | 218,053 | ‐154,339 | ‐41.4% | ‐150,091 | ‐40.8% | 180,850 | 100,995 | 95,185 | 96,796 | 92,699 | 142,810 | ‐90,085 to ‐81,789 | ‐49.3% to ‐44.7% | ‐4,204 to 4,092 | ‐4.3% to 4.2% | ‐88,151 to ‐79,855 | ‐48.7% to ‐44.2% |
Passenger number
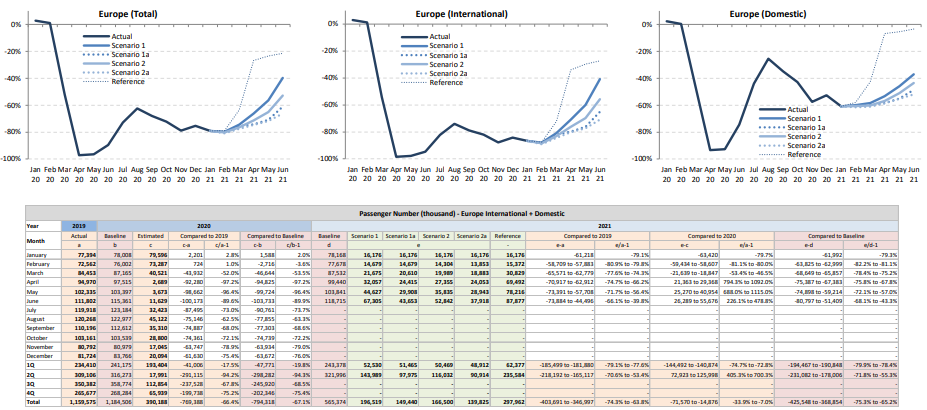
Passenger number
| Passenger Number (thousand) ‐ Europe International | |||||||||||||||||||
| Year | 2019 | 2020 | 2021 | ||||||||||||||||
| Month | Actual | Baseline | Estimated | Compared to 2019 | Compared to Baseline | Baseline | Scenario 1 | Scenario 1a | Scenario 2 | Scenario 2a | Reference | Compared to 2019 | Compared to 2020 | Compared to Baseline | |||||
| a | b | c | c‐a | c/a‐1 | c‐b | c/b‐1 | d | e | ‐ | e‐a | e/a‐1 | e‐c | e/a‐1 | e‐d | e/d‐1 | ||||
| January | 54,881 | 55,743 | 56,557 | 1,676 | 3.1% | 814 | 1.5% | 56,110 | 7,370 | 7,370 | 7,370 | 7,370 | 7,370 | ‐47,511 | ‐86.6% | ‐49,187 | ‐87.0% | ‐48,740 | ‐86.9% |
| February | 51,178 | 54,626 | 51,816 | 639 | 1.2% | ‐2,810 | ‐5.1% | 55,766 | 6,764 | 6,764 | 6,486 | 6,208 | 7,057 | ‐44,970 to ‐44,414 | ‐87.9% to ‐86.8% | ‐45,608 to ‐45,052 | ‐88.0% to ‐86.9% | ‐49,558 to ‐49,002 | ‐88.9% to ‐87.9% |
| March | 59,791 | 62,825 | 27,468 | ‐32,322 | ‐54.1% | ‐35,357 | ‐56.3% | 63,466 | 13,166 | 12,376 | 11,706 | 10,653 | 18,553 | ‐49,137 to ‐46,625 | ‐82.2% to ‐78.0% | ‐16,815 to ‐14,302 | ‐61.2% to ‐52.1% | ‐52,813 to ‐50,300 | ‐83.2% to ‐79.3% |
| April | 70,397 | 72,906 | 1,054 | ‐69,343 | ‐98.5% | ‐71,853 | ‐98.6% | 74,986 | 22,867 | 16,183 | 18,628 | 15,544 | 47,376 | ‐54,853 to ‐47,530 | ‐77.9% to ‐67.5% | 14,490 to 21,814 | 1375.4% to 2070.5% | ‐59,442 to ‐52,118 | ‐79.3% to ‐69.5% |
| May | 76,311 | 77,402 | 1,741 | ‐74,570 | ‐97.7% | ‐75,661 | ‐97.8% | 77,771 | 32,689 | 20,411 | 25,127 | 19,025 | 54,003 | ‐57,286 to ‐43,622 | ‐75.1% to ‐57.2% | 17,284 to 30,949 | 992.9% to 1777.8% | ‐58,745 to ‐45,081 | ‐75.5% to ‐58.0% |
| June | 83,994 | 87,585 | 4,545 | ‐79,449 | ‐94.6% | ‐83,040 | ‐94.8% | 90,866 | 51,117 | 31,754 | 39,649 | 26,609 | 61,276 | ‐57,385 to ‐32,878 | ‐68.3% to ‐39.1% | 22,064 to 46,572 | 485.5% to 1024.7% | ‐64,257 to ‐39,749 | ‐70.7% to ‐43.7% |
| July | 91,067 | 94,366 | 16,270 | ‐74,797 | ‐82.1% | ‐78,096 | ‐82.8% | ‐ | ‐ | ‐ | ‐ | ‐ | ‐ | ‐ | ‐ | ‐ | ‐ | ‐ | ‐ |
| August | 91,837 | 94,578 | 23,925 | ‐67,912 | ‐73.9% | ‐70,652 | ‐74.7% | ‐ | ‐ | ‐ | ‐ | ‐ | ‐ | ‐ | ‐ | ‐ | ‐ | ‐ | ‐ |
| September | 82,874 | 85,320 | 17,468 | ‐65,406 | ‐78.9% | ‐67,852 | ‐79.5% | ‐ | ‐ | ‐ | ‐ | ‐ | ‐ | ‐ | ‐ | ‐ | ‐ | ‐ | ‐ |
| October | 76,950 | 77,619 | 13,812 | ‐63,138 | ‐82.1% | ‐63,808 | ‐82.2% | ‐ | ‐ | ‐ | ‐ | ‐ | ‐ | ‐ | ‐ | ‐ | ‐ | ‐ | ‐ |
| November | 57,404 | 57,850 | 7,084 | ‐50,319 | ‐87.7% | ‐50,765 | ‐87.8% | ‐ | ‐ | ‐ | ‐ | ‐ | ‐ | ‐ | ‐ | ‐ | ‐ | ‐ | ‐ |
| December | 58,838 | 61,260 | 9,236 | ‐49,602 | ‐84.3% | ‐52,023 | ‐84.9% | ‐ | ‐ | ‐ | ‐ | ‐ | ‐ | ‐ | ‐ | ‐ | ‐ | ‐ | ‐ |
| 1Q | 165,849 | 173,194 | 135,842 | ‐30,007 | ‐18.1% | ‐37,352 | ‐21.6% | 175,342 | 27,300 | 26,510 | 25,561 | 24,231 | 32,980 | ‐141,618 to ‐138,549 | ‐85.4% to ‐83.5% | ‐111,611 to ‐108,542 | ‐82.2% to ‐79.9% | ‐151,111 to ‐148,042 | ‐86.2% to ‐84.4% |
| 2Q | 230,702 | 237,893 | 7,339 | ‐223,363 | ‐96.8% | ‐230,553 | ‐96.9% | 243,622 | 106,673 | 68,348 | 83,403 | 61,179 | 162,655 | ‐169,524 to ‐124,029 | ‐73.5% to ‐53.8% | 53,839 to 99,334 | 733.6% to 1353.4% | ‐182,444 to ‐136,949 | ‐74.9% to ‐56.2% |
| 3Q | 265,778 | 274,263 | 57,663 | ‐208,114 | ‐78.3% | ‐216,600 | ‐79.0% | ‐ | ‐ | ‐ | ‐ | ‐ | ‐ | ‐ | ‐ | ‐ | ‐ | ‐ | ‐ |
| 4Q | 193,192 | 196,728 | 30,132 | ‐163,060 | ‐84.4% | ‐166,596 | ‐84.7% | ‐ | ‐ | ‐ | ‐ | ‐ | ‐ | ‐ | ‐ | ‐ | ‐ | ‐ | ‐ |
| Total | 855,522 | 882,079 | 230,977 | ‐624,545 | ‐73.0% | ‐651,102 | ‐73.8% | 418,964 | 133,973 | 94,858 | 108,964 | 85,410 | 195,635 | ‐311,142 to ‐262,578 | ‐78.5% to ‐66.2% | ‐57,772 to ‐9,208 | ‐40.3% to ‐6.4% | ‐333,555 to ‐284,991 | ‐79.6% to ‐68.0% |
| Passenger Number (thousand) ‐ Europe Domestic | |||||||||||||||||||
| Year | 2019 | 2020 | 2021 | ||||||||||||||||
| Month | Actual | Baseline | Estimated | Compared to 2019 | Compared to Baseline | Baseline | Scenario 1 | Scenario 1a | Scenario 2 | Scenario 2a | Reference | Compared to 2019 | Compared to 2020 | Compared to Baseline | |||||
| a | b | c | c‐a | c/a‐1 | c‐b | c/b‐1 | d | e | ‐ | e‐a | e/a‐1 | e‐c | e/a‐1 | e‐d | e/d‐1 | ||||
| January | 22,514 | 22,264 | 23,037 | 524 | 2.3% | 774 | 3.5% | 22,058 | 8,806 | 8,806 | 8,806 | 8,806 | 8,806 | ‐13,707 | ‐60.9% | ‐14,231 | ‐61.8% | ‐13,252 | ‐60.1% |
| February | 21,385 | 21,376 | 21,469 | 85 | 0.4% | 94 | 0.4% | 21,912 | 9,007 | 9,007 | 8,812 | 8,604 | 9,247 | ‐12,780 to ‐12,377 | ‐59.8% to ‐57.9% | ‐12,865 to ‐12,462 | ‐59.9% to ‐58.0% | ‐13,308 to ‐12,905 | ‐60.7% to ‐58.9% |
| March | 24,663 | 24,339 | 13,052 | ‐11,610 | ‐47.1% | ‐11,287 | ‐46.4% | 24,065 | 11,086 | 10,675 | 10,540 | 10,314 | 15,365 | ‐14,348 to ‐13,577 | ‐58.2% to ‐55.0% | ‐2,738 to ‐1,966 | ‐21.0% to ‐15.1% | ‐13,751 to ‐12,979 | ‐57.1% to ‐53.9% |
| April | 24,573 | 24,608 | 1,637 | ‐22,936 | ‐93.3% | ‐22,971 | ‐93.3% | 24,455 | 12,330 | 11,027 | 11,362 | 10,889 | 23,171 | ‐13,684 to ‐12,243 | ‐55.7% to ‐49.8% | 9,252 to 10,693 | 565.2% to 653.3% | ‐13,565 to ‐12,124 | ‐55.5% to ‐49.6% |
| May | 26,023 | 25,994 | 1,932 | ‐24,091 | ‐92.6% | ‐24,062 | ‐92.6% | 26,070 | 15,010 | 12,541 | 13,444 | 12,366 | 24,745 | ‐13,657 to ‐11,013 | ‐52.5% to ‐42.3% | 10,434 to 13,078 | 540.0% to 676.9% | ‐13,704 to ‐11,060 | ‐52.6% to ‐42.4% |
| June | 27,807 | 27,776 | 7,086 | ‐20,721 | ‐74.5% | ‐20,690 | ‐74.5% | 27,849 | 18,228 | 15,270 | 16,481 | 14,166 | 26,882 | ‐13,642 to ‐9,580 | ‐49.1% to ‐34.4% | 7,080 to 11,142 | 99.9% to 157.2% | ‐13,683 to ‐9,621 | ‐49.1% to ‐34.5% |
| July | 28,851 | 28,819 | 16,161 | ‐12,690 | ‐44.0% | ‐12,658 | ‐43.9% | ‐ | ‐ | ‐ | ‐ | ‐ | ‐ | ‐ | ‐ | ‐ | ‐ | ‐ | ‐ |
| August | 28,431 | 28,399 | 21,207 | ‐7,224 | ‐25.4% | ‐7,192 | ‐25.3% | ‐ | ‐ | ‐ | ‐ | ‐ | ‐ | ‐ | ‐ | ‐ | ‐ | ‐ | ‐ |
| September | 27,322 | 27,292 | 17,851 | ‐9,471 | ‐34.7% | ‐9,441 | ‐34.6% | ‐ | ‐ | ‐ | ‐ | ‐ | ‐ | ‐ | ‐ | ‐ | ‐ | ‐ | ‐ |
| October | 26,211 | 25,920 | 14,996 | ‐11,215 | ‐42.8% | ‐10,924 | ‐42.1% | ‐ | ‐ | ‐ | ‐ | ‐ | ‐ | ‐ | ‐ | ‐ | ‐ | ‐ | ‐ |
| November | 23,388 | 23,128 | 9,965 | ‐13,424 | ‐57.4% | ‐13,164 | ‐56.9% | ‐ | ‐ | ‐ | ‐ | ‐ | ‐ | ‐ | ‐ | ‐ | ‐ | ‐ | ‐ |
| December | 22,886 | 22,506 | 10,857 | ‐12,028 | ‐52.6% | ‐11,649 | ‐51.8% | ‐ | ‐ | ‐ | ‐ | ‐ | ‐ | ‐ | ‐ | ‐ | ‐ | ‐ | ‐ |
| 1Q | 68,561 | 67,978 | 57,559 | ‐11,002 | ‐16.0% | ‐10,419 | ‐15.3% | 68,036 | 28,900 | 28,489 | 28,159 | 27,725 | 33,418 | ‐40,836 to ‐39,661 | ‐59.6% to ‐57.8% | ‐29,834 to ‐28,659 | ‐51.8% to ‐49.8% | ‐40,311 to ‐39,136 | ‐59.2% to ‐57.5% |
| 2Q | 78,404 | 78,378 | 10,655 | ‐67,749 | ‐86.4% | ‐67,723 | ‐86.4% | 78,373 | 45,568 | 38,838 | 41,287 | 37,421 | 74,797 | ‐40,983 to ‐32,836 | ‐52.3% to ‐41.9% | 26,766 to 34,913 | 251.2% to 327.7% | ‐40,952 to ‐32,805 | ‐52.3% to ‐41.9% |
| 3Q | 84,604 | 84,509 | 55,219 | ‐29,385 | ‐34.7% | ‐29,290 | ‐34.7% | ‐ | ‐ | ‐ | ‐ | ‐ | ‐ | ‐ | ‐ | ‐ | ‐ | ‐ | ‐ |
| 4Q | 72,485 | 71,555 | 35,818 | ‐36,667 | ‐50.6% | ‐35,737 | ‐49.9% | ‐ | ‐ | ‐ | ‐ | ‐ | ‐ | ‐ | ‐ | ‐ | ‐ | ‐ | ‐ |
| Total | 304,054 | 302,420 | 159,251 | ‐144,803 | ‐47.6% | ‐143,169 | ‐47.3% | 146,409 | 74,468 | 67,326 | 69,445 | 65,146 | 108,216 | ‐81,819 to ‐72,497 | ‐55.7% to ‐49.3% | ‐3,068 to 6,254 | ‐4.5% to 9.2% | ‐81,263 to ‐71,942 | ‐55.5% to ‐49.1% |
Passenger revenue
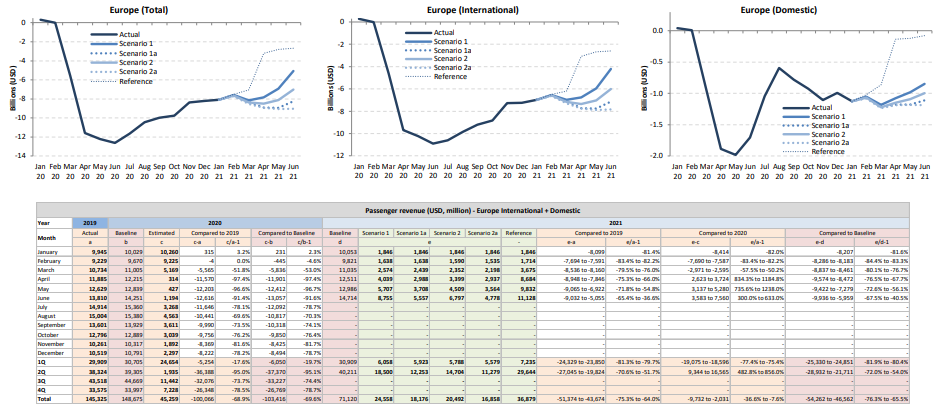
Passenger revenue
| Passenger revenue (USD, million) ‐ Europe International | |||||||||||||||||||
| Year | 2019 | 2020 | 2021 | ||||||||||||||||
| Month | Actual | Baseline | Estimated | Compared to 2019 | Compared to Baseline | Baseline | Scenario 1 | Scenario 1a | Scenario 2 | Scenario 2a | Reference | Compared to 2019 | Compared to 2020 | Compared to Baseline | |||||
| a | b | c | c‐a | c/a‐1 | c‐b | c/b‐1 | d | e | ‐ | e‐a | e/a‐1 | e‐c | e/a‐1 | e‐d | e/d‐1 | ||||
| January | 8,094 | 8,199 | 8,366 | 272 | 3.4% | 167 | 2.0% | 8,240 | 1,122 | 1,122 | 1,122 | 1,122 | 1,122 | ‐6,972 | ‐86.1% | ‐7,244 | ‐86.6% | ‐7,118 | ‐86.4% |
| February | 7,471 | 7,913 | 7,460 | ‐11 | ‐0.1% | ‐453 | ‐5.7% | 8,019 | 1,031 | 1,031 | 989 | 947 | 1,076 | ‐6,525 to ‐6,440 | ‐87.3% to ‐86.2% | ‐6,513 to ‐6,429 | ‐87.3% to ‐86.2% | ‐7,073 to ‐6,988 | ‐88.2% to ‐87.1% |
| March | 8,707 | 9,004 | 4,096 | ‐4,611 | ‐53.0% | ‐4,908 | ‐54.5% | 9,057 | 1,993 | 1,873 | 1,774 | 1,616 | 2,789 | ‐7,091 to ‐6,714 | ‐81.4% to ‐77.1% | ‐2,480 to ‐2,103 | ‐60.5% to ‐51.3% | ‐7,441 to ‐7,064 | ‐82.2% to ‐78.0% |
| April | 9,864 | 10,192 | 180 | ‐9,684 | ‐98.2% | ‐10,012 | ‐98.2% | 10,501 | 3,433 | 2,444 | 2,806 | 2,347 | 6,921 | ‐7,517 to ‐6,432 | ‐76.2% to ‐65.2% | 2,167 to 3,253 | 1205.2% to 1808.7% | ‐8,153 to ‐7,068 | ‐77.6% to ‐67.3% |
| May | 10,490 | 10,702 | 268 | ‐10,222 | ‐97.4% | ‐10,434 | ‐97.5% | 10,842 | 4,861 | 3,070 | 3,759 | 2,861 | 7,872 | ‐7,628 to ‐5,628 | ‐72.7% to ‐53.7% | 2,594 to 4,594 | 969.0% to 1716.2% | ‐7,981 to ‐5,981 | ‐73.6% to ‐55.2% |
| June | 11,524 | 11,967 | 612 | ‐10,912 | ‐94.7% | ‐11,356 | ‐94.9% | 12,424 | 7,510 | 4,733 | 5,869 | 3,982 | 8,966 | ‐7,542 to ‐4,014 | ‐65.4% to ‐34.8% | 3,370 to 6,898 | 550.8% to 1127.3% | ‐8,442 to ‐4,914 | ‐67.9% to ‐39.6% |
| July | 12,542 | 12,991 | 1,940 | ‐10,602 | ‐84.5% | ‐11,051 | ‐85.1% | ‐ | ‐ | ‐ | ‐ | ‐ | ‐ | ‐ | ‐ | ‐ | ‐ | ‐ | ‐ |
| August | 12,666 | 13,045 | 2,821 | ‐9,846 | ‐77.7% | ‐10,224 | ‐78.4% | ‐ | ‐ | ‐ | ‐ | ‐ | ‐ | ‐ | ‐ | ‐ | ‐ | ‐ | ‐ |
| September | 11,354 | 11,685 | 2,144 | ‐9,210 | ‐81.1% | ‐9,541 | ‐81.7% | ‐ | ‐ | ‐ | ‐ | ‐ | ‐ | ‐ | ‐ | ‐ | ‐ | ‐ | ‐ |
| October | 10,641 | 10,758 | 1,807 | ‐8,834 | ‐83.0% | ‐8,951 | ‐83.2% | ‐ | ‐ | ‐ | ‐ | ‐ | ‐ | ‐ | ‐ | ‐ | ‐ | ‐ | ‐ |
| November | 8,338 | 8,415 | 1,073 | ‐7,265 | ‐87.1% | ‐7,343 | ‐87.3% | ‐ | ‐ | ‐ | ‐ | ‐ | ‐ | ‐ | ‐ | ‐ | ‐ | ‐ | ‐ |
| December | 8,637 | 8,940 | 1,404 | ‐7,233 | ‐83.7% | ‐7,536 | ‐84.3% | ‐ | ‐ | ‐ | ‐ | ‐ | ‐ | ‐ | ‐ | ‐ | ‐ | ‐ | ‐ |
| 1Q | 24,272 | 25,116 | 19,922 | ‐4,350 | ‐17.9% | ‐5,194 | ‐20.7% | 25,316 | 4,146 | 4,027 | 3,885 | 3,684 | 4,987 | ‐20,587 to ‐20,126 | ‐84.8% to ‐82.9% | ‐16,238 to ‐15,776 | ‐81.5% to ‐79.2% | ‐21,631 to ‐21,170 | ‐85.4% to ‐83.6% |
| 2Q | 31,878 | 32,861 | 1,059 | ‐30,818 | ‐96.7% | ‐31,802 | ‐96.8% | 33,767 | 15,804 | 10,248 | 12,434 | 9,191 | 23,760 | ‐22,687 to ‐16,074 | ‐71.2% to ‐50.4% | 8,131 to 14,745 | 767.5% to 1391.7% | ‐24,576 to ‐17,963 | ‐72.8% to ‐53.2% |
| 3Q | 36,562 | 37,721 | 6,904 | ‐29,658 | ‐81.1% | ‐30,816 | ‐81.7% | ‐ | ‐ | ‐ | ‐ | ‐ | ‐ | ‐ | ‐ | ‐ | ‐ | ‐ | ‐ |
| 4Q | 27,616 | 28,114 | 4,284 | ‐23,332 | ‐84.5% | ‐23,830 | ‐84.8% | ‐ | ‐ | ‐ | ‐ | ‐ | ‐ | ‐ | ‐ | ‐ | ‐ | ‐ | ‐ |
| Total | 120,328 | 123,811 | 32,169 | ‐88,158 | ‐73.3% | ‐91,642 | ‐74.0% | 59,083 | 19,950 | 14,274 | 16,319 | 12,875 | 28,747 | ‐43,274 to ‐36,199 | ‐77.1% to ‐64.5% | ‐8,106 to ‐1,031 | ‐38.6% to ‐4.9% | ‐46,208 to ‐39,133 | ‐78.2% to ‐66.2% |
| Passenger revenue (USD, million) ‐ Europe Domestic | |||||||||||||||||||
| Year | 2019 | 2020 | 2021 | ||||||||||||||||
| Month | Actual | Baseline | Estimated | Compared to 2019 | Compared to Baseline | Baseline | Scenario 1 | Scenario 1a | Scenario 2 | Scenario 2a | Reference | Compared to 2019 | Compared to 2020 | Compared to Baseline | |||||
| a | b | c | c‐a | c/a‐1 | c‐b | c/b‐1 | d | e | ‐ | e‐a | e/a‐1 | e‐c | e/a‐1 | e‐d | e/d‐1 | ||||
| January | 1,851 | 1,830 | 1,894 | 43 | 2.3% | 64 | 3.5% | 1,814 | 724 | 724 | 724 | 724 | 724 | ‐1,127 | ‐60.9% | ‐1,170 | ‐61.8% | ‐1,090 | ‐60.1% |
| February | 1,758 | 1,757 | 1,765 | 7 | 0.4% | 8 | 0.4% | 1,802 | 741 | 741 | 725 | 707 | 760 | ‐1,051 to ‐1,018 | ‐59.8% to ‐57.9% | ‐1,058 to ‐1,025 | ‐59.9% to ‐58.0% | ‐1,094 to ‐1,061 | ‐60.7% to ‐58.9% |
| March | 2,028 | 2,001 | 1,073 | ‐955 | ‐47.1% | ‐928 | ‐46.4% | 1,979 | 911 | 878 | 867 | 848 | 1,263 | ‐1,180 to ‐1,116 | ‐58.2% to ‐55.0% | ‐225 to ‐162 | ‐21.0% to ‐15.1% | ‐1,131 to ‐1,067 | ‐57.1% to ‐53.9% |
| April | 2,020 | 2,023 | 135 | ‐1,886 | ‐93.3% | ‐1,889 | ‐93.3% | 2,011 | 1,014 | 907 | 934 | 895 | 1,905 | ‐1,125 to ‐1,007 | ‐55.7% to ‐49.8% | 761 to 879 | 565.2% to 653.3% | ‐1,115 to ‐997 | ‐55.5% to ‐49.6% |
| May | 2,140 | 2,137 | 159 | ‐1,981 | ‐92.6% | ‐1,978 | ‐92.6% | 2,143 | 1,234 | 1,031 | 1,105 | 1,017 | 2,034 | ‐1,123 to ‐905 | ‐52.5% to ‐42.3% | 858 to 1,075 | 540.0% to 676.9% | ‐1,127 to ‐909 | ‐52.6% to ‐42.4% |
| June | 2,286 | 2,284 | 583 | ‐1,704 | ‐74.5% | ‐1,701 | ‐74.5% | 2,290 | 1,499 | 1,255 | 1,355 | 1,165 | 2,210 | ‐1,122 to ‐788 | ‐49.1% to ‐34.4% | 582 to 916 | 99.9% to 157.2% | ‐1,125 to ‐791 | ‐49.1% to ‐34.5% |
| July | 2,372 | 2,369 | 1,329 | ‐1,043 | ‐44.0% | ‐1,041 | ‐43.9% | ‐ | ‐ | ‐ | ‐ | ‐ | ‐ | ‐ | ‐ | ‐ | ‐ | ‐ | ‐ |
| August | 2,337 | 2,335 | 1,744 | ‐594 | ‐25.4% | ‐591 | ‐25.3% | ‐ | ‐ | ‐ | ‐ | ‐ | ‐ | ‐ | ‐ | ‐ | ‐ | ‐ | ‐ |
| September | 2,246 | 2,244 | 1,468 | ‐779 | ‐34.7% | ‐776 | ‐34.6% | ‐ | ‐ | ‐ | ‐ | ‐ | ‐ | ‐ | ‐ | ‐ | ‐ | ‐ | ‐ |
| October | 2,155 | 2,131 | 1,233 | ‐922 | ‐42.8% | ‐898 | ‐42.1% | ‐ | ‐ | ‐ | ‐ | ‐ | ‐ | ‐ | ‐ | ‐ | ‐ | ‐ | ‐ |
| November | 1,923 | 1,902 | 819 | ‐1,104 | ‐57.4% | ‐1,082 | ‐56.9% | ‐ | ‐ | ‐ | ‐ | ‐ | ‐ | ‐ | ‐ | ‐ | ‐ | ‐ | ‐ |
| December | 1,882 | 1,850 | 893 | ‐989 | ‐52.6% | ‐958 | ‐51.8% | ‐ | ‐ | ‐ | ‐ | ‐ | ‐ | ‐ | ‐ | ‐ | ‐ | ‐ | ‐ |
| 1Q | 5,637 | 5,589 | 4,732 | ‐905 | ‐16.0% | ‐857 | ‐15.3% | 5,594 | 2,376 | 2,342 | 2,315 | 2,279 | 2,747 | ‐3,357 to ‐3,261 | ‐59.6% to ‐57.8% | ‐2,453 to ‐2,356 | ‐51.8% to ‐49.8% | ‐3,314 to ‐3,218 | ‐59.2% to ‐57.5% |
| 2Q | 6,446 | 6,444 | 876 | ‐5,570 | ‐86.4% | ‐5,568 | ‐86.4% | 6,443 | 3,746 | 3,193 | 3,394 | 3,077 | 6,149 | ‐3,369 to ‐2,700 | ‐52.3% to ‐41.9% | 2,201 to 2,870 | 251.2% to 327.7% | ‐3,367 to ‐2,697 | ‐52.3% to ‐41.9% |
| 3Q | 6,956 | 6,948 | 4,540 | ‐2,416 | ‐34.7% | ‐2,408 | ‐34.7% | ‐ | ‐ | ‐ | ‐ | ‐ | ‐ | ‐ | ‐ | ‐ | ‐ | ‐ | ‐ |
| 4Q | 5,959 | 5,883 | 2,945 | ‐3,015 | ‐50.6% | ‐2,938 | ‐49.9% | ‐ | ‐ | ‐ | ‐ | ‐ | ‐ | ‐ | ‐ | ‐ | ‐ | ‐ | ‐ |
| Total | 24,998 | 24,863 | 13,093 | ‐11,905 | ‐47.6% | ‐11,771 | ‐47.3% | 12,037 | 6,122 | 5,535 | 5,709 | 5,356 | 8,897 | ‐6,727 to ‐5,960 | ‐55.7% to ‐49.3% | ‐252 to 514 | ‐4.5% to 9.2% | ‐6,681 to ‐5,915 | ‐55.5% to ‐49.1% |
| Compared to 2019 | Seat capacity (%) | Passenger number (thousand) | Passenger revenue (USD, million) | |||||||||
| Total | International | Domestic | Total | International | Domestic | Total | International | Domestic | ||||
| 1Q 2020 | ‐6.3% | ‐9.5% | ‐4.4% | ‐8,770 | ‐10.1% | ‐4,698 | ‐15.0% | ‐4,072 | ‐7.3% | ‐1,321 | ‐976 | ‐346 |
| 2Q 2020 | ‐89.6% | ‐91.6% | ‐88.5% | ‐76,687 | ‐92.2% | ‐28,082 | ‐96.1% | ‐48,606 | ‐90.0% | ‐9,679 | ‐5,628 | ‐4,051 |
| 3Q 2020 | ‐72.4% | ‐79.3% | ‐68.9% | ‐67,726 | ‐77.5% | ‐26,240 | ‐89.4% | ‐41,485 | ‐71.5% | ‐8,805 | ‐5,319 | ‐3,486 |
| 4Q 2020 | ‐47.1% | ‐60.4% | ‐40.4% | ‐45,697 | ‐52.7% | ‐21,778 | ‐76.2% | ‐23,919 | ‐41.2% | ‐6,450 | ‐4,434 | ‐2,016 |
| Total 2020 | ‐53.3% | ‐58.9% | ‐50.4% | ‐198,880 | ‐57.8% | ‐80,799 | ‐68.2% | ‐118,082 | ‐52.3% | ‐26,256 | ‐16,358 | ‐9,898 |
| 1Q 2021 | ‐40.8% to ‐39.4% | ‐54.7% to ‐53.2% | ‐32.7% to ‐31.3% | ‐41,389 to ‐39,705 | ‐47.7% to ‐45.8% | ‐22,066 to ‐21,252 | ‐70.5% to ‐67.9% | ‐19,323 to ‐18,453 | ‐34.9% to ‐33.3% | ‐6,148 to ‐5,917 | ‐4,515 to ‐4,357 | ‐1,632 to ‐1,560 |
| 2Q 2021 | ‐30.3% to ‐20.7% | ‐41.3% to ‐29.1% | ‐24.3% to ‐16.2% | ‐31,923 to ‐22,295 | ‐38.4% to ‐26.8% | ‐17,580 to ‐12,690 | ‐60.2% to ‐43.4% | ‐14,344 to ‐9,606 | ‐26.6% to ‐17.8% | ‐4,799 to ‐3,447 | ‐3,600 to ‐2,641 | ‐1,200 to ‐806 |
| 3Q 2021 | ‐ | ‐ | ‐ | ‐ | ‐ | ‐ | ‐ | ‐ | ‐ | ‐ | ‐ | ‐ |
| 4Q 2021 | ‐ | ‐ | ‐ | ‐ | ‐ | ‐ | ‐ | ‐ | ‐ | ‐ | ‐ | ‐ |
| Total 1Q/2Q 2021 | ‐35.7% to ‐30.3% | ‐48.3% to ‐41.7% | ‐28.6% to ‐23.8% | ‐73,313 to ‐62,001 | ‐43.1% to ‐36.5% | ‐39,646 to ‐33,942 | ‐65.5% to ‐56.1% | ‐33,667 to ‐28,059 | ‐30.8% to ‐25.6% | ‐10,947 to ‐9,364 | ‐8,115 to ‐6,998 | ‐2,832 to ‐2,366 |
Seat capacity
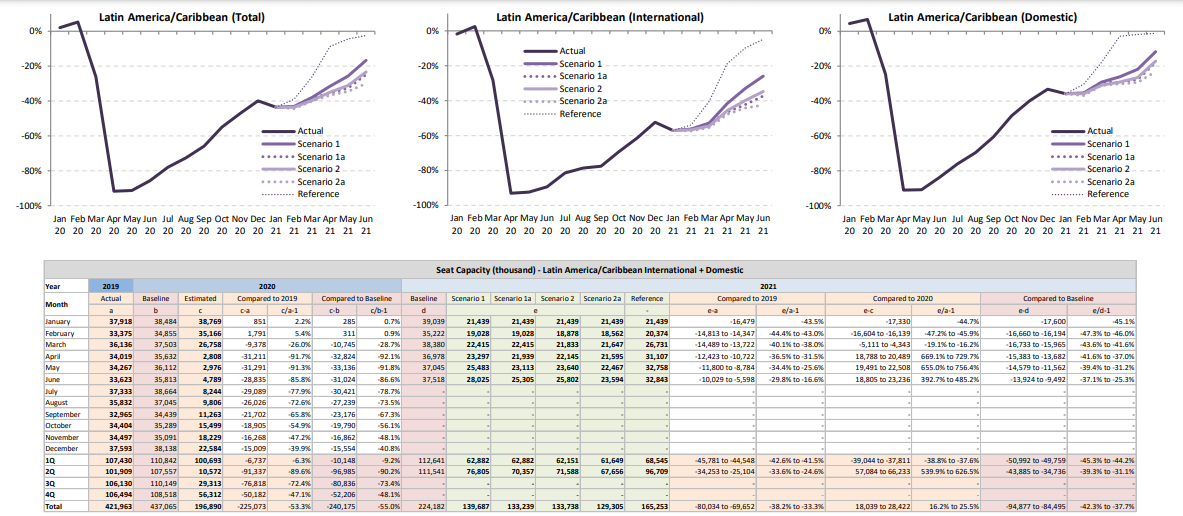
Seat capacity
| Seat Capacity (thousand) ‐ Latin America/Caribbean International | |||||||||||||||||||
| Year | 2019 | 2020 | 2021 | ||||||||||||||||
| Month | Actual | Baseline | Estimated | Compared to 2019 | Compared to Baseline | Baseline | Scenario 1 | Scenario 1a | Scenario 2 | Scenario 2a | Reference | Compared to 2019 | Compared to 2020 | Compared to Baseline | |||||
| a | b | c | c‐a | c/a‐1 | c‐b | c/b‐1 | d | e | ‐ | e‐a | e/a‐1 | e‐c | e/a‐1 | e‐d | e/d‐1 | ||||
| January | 13,804 | 13,528 | 13,553 | ‐251 | ‐1.8% | 25 | 0.2% | 13,383 | 5,931 | 5,931 | 5,931 | 5,931 | 5,931 | ‐7,873 | ‐57.0% | ‐7,621 | ‐56.2% | ‐7,452 | ‐55.7% |
| February | 12,228 | 12,396 | 12,543 | 315 | 2.6% | 147 | 1.2% | 12,292 | 5,721 | 5,721 | 5,634 | 5,540 | 5,913 | ‐6,688 to ‐6,507 | ‐54.7% to ‐53.2% | ‐7,003 to ‐6,822 | ‐55.8% to ‐54.4% | ‐6,752 to ‐6,571 | ‐54.9% to ‐53.5% |
| March | 13,495 | 13,244 | 9,676 | ‐3,820 | ‐28.3% | ‐3,569 | ‐26.9% | 12,936 | 6,850 | 6,850 | 6,557 | 6,420 | 8,611 | ‐7,076 to ‐6,646 | ‐52.4% to ‐49.2% | ‐3,256 to ‐2,826 | ‐33.7% to ‐29.2% | ‐6,516 to ‐6,086 | ‐50.4% to ‐47.0% |
| April | 12,170 | 12,539 | 840 | ‐11,331 | ‐93.1% | ‐11,700 | ‐93.3% | 12,809 | 7,625 | 6,993 | 7,055 | 6,771 | 10,516 | ‐5,400 to ‐4,546 | ‐44.4% to ‐37.3% | 5,931 to 6,785 | 706.1% to 807.8% | ‐6,038 to ‐5,184 | ‐47.1% to ‐40.5% |
| May | 11,787 | 12,242 | 906 | ‐10,881 | ‐92.3% | ‐11,336 | ‐92.6% | 12,632 | 8,436 | 7,311 | 7,532 | 7,004 | 10,801 | ‐4,783 to ‐3,351 | ‐40.6% to ‐28.4% | 6,098 to 7,530 | 673.0% to 831.1% | ‐5,627 to ‐4,195 | ‐44.5% to ‐33.2% |
| June | 11,834 | 12,226 | 1,253 | ‐10,580 | ‐89.4% | ‐10,972 | ‐89.7% | 12,508 | 9,333 | 7,921 | 8,188 | 7,250 | 11,380 | ‐4,584 to ‐2,501 | ‐38.7% to ‐21.1% | 5,997 to 8,079 | 478.5% to 644.7% | ‐5,258 to ‐3,175 | ‐42.0% to ‐25.4% |
| July | 12,806 | 13,103 | 2,371 | ‐10,434 | ‐81.5% | ‐10,732 | ‐81.9% | ‐ | ‐ | ‐ | ‐ | ‐ | ‐ | ‐ | ‐ | ‐ | ‐ | ‐ | ‐ |
| August | 12,203 | 12,642 | 2,607 | ‐9,596 | ‐78.6% | ‐10,035 | ‐79.4% | ‐ | ‐ | ‐ | ‐ | ‐ | ‐ | ‐ | ‐ | ‐ | ‐ | ‐ | ‐ |
| September | 10,491 | 11,018 | 2,364 | ‐8,127 | ‐77.5% | ‐8,654 | ‐78.5% | ‐ | ‐ | ‐ | ‐ | ‐ | ‐ | ‐ | ‐ | ‐ | ‐ | ‐ | ‐ |
| October | 10,906 | 10,820 | 3,373 | ‐7,533 | ‐69.1% | ‐7,446 | ‐68.8% | ‐ | ‐ | ‐ | ‐ | ‐ | ‐ | ‐ | ‐ | ‐ | ‐ | ‐ | ‐ |
| November | 11,631 | 11,459 | 4,483 | ‐7,149 | ‐61.5% | ‐6,977 | ‐60.9% | ‐ | ‐ | ‐ | ‐ | ‐ | ‐ | ‐ | ‐ | ‐ | ‐ | ‐ | ‐ |
| December | 13,268 | 13,108 | 6,332 | ‐6,936 | ‐52.3% | ‐6,776 | ‐51.7% | ‐ | ‐ | ‐ | ‐ | ‐ | ‐ | ‐ | ‐ | ‐ | ‐ | ‐ | ‐ |
| 1Q | 39,527 | 39,168 | 35,772 | ‐3,756 | ‐9.5% | ‐3,396 | ‐8.7% | 38,611 | 18,502 | 18,502 | 18,123 | 17,891 | 20,456 | ‐21,636 to ‐21,025 | ‐54.7% to ‐53.2% | ‐17,880 to ‐17,270 | ‐50.0% to ‐48.3% | ‐20,720 to ‐20,109 | ‐53.7% to ‐52.1% |
| 2Q | 35,791 | 37,007 | 2,999 | ‐32,792 | ‐91.6% | ‐34,007 | ‐91.9% | 37,948 | 25,394 | 22,225 | 22,775 | 21,025 | 32,697 | ‐14,766 to ‐10,398 | ‐41.3% to ‐29.1% | 18,026 to 22,394 | 601.0% to 746.7% | ‐16,924 to ‐12,555 | ‐44.6% to ‐33.1% |
| 3Q | 35,499 | 36,763 | 7,342 | ‐28,157 | ‐79.3% | ‐29,421 | ‐80.0% | ‐ | ‐ | ‐ | ‐ | ‐ | ‐ | ‐ | ‐ | ‐ | ‐ | ‐ | ‐ |
| 4Q | 35,805 | 35,387 | 14,188 | ‐21,617 | ‐60.4% | ‐21,199 | ‐59.9% | ‐ | ‐ | ‐ | ‐ | ‐ | ‐ | ‐ | ‐ | ‐ | ‐ | ‐ | ‐ |
| Total | 146,623 | 148,324 | 60,301 | ‐86,322 | ‐58.9% | ‐88,024 | ‐59.3% | 76,559 | 43,896 | 40,728 | 40,898 | 38,916 | 53,153 | ‐36,402 to ‐31,423 | ‐48.3% to ‐41.7% | 145 to 5,125 | 0.4% to 13.2% | ‐37,643 to ‐32,664 | ‐49.2% to ‐42.7% |
| Seat Capacity (thousand) ‐ Latin America/Caribbean Domestic | |||||||||||||||||||
| Year | 2019 | 2020 | 2021 | ||||||||||||||||
| Month | Actual | Baseline | Estimated | Compared to 2019 | Compared to Baseline | Baseline | Scenario 1 | Scenario 1a | Scenario 2 | Scenario 2a | Reference | Compared to 2019 | Compared to 2020 | Compared to Baseline | |||||
| a | b | c | c‐a | c/a‐1 | c‐b | c/b‐1 | d | e | ‐ | e‐a | e/a‐1 | e‐c | e/a‐1 | e‐d | e/d‐1 | ||||
| January | 24,114 | 24,956 | 25,216 | 1,102 | 4.6% | 260 | 1.0% | 25,656 | 15,508 | 15,508 | 15,508 | 15,508 | 15,508 | ‐8,606 | ‐35.7% | ‐9,708 | ‐38.5% | ‐10,148 | ‐39.6% |
| February | 21,147 | 22,459 | 22,623 | 1,476 | 7.0% | 164 | 0.7% | 22,930 | 14,315 | 14,315 | 14,135 | 13,899 | 15,096 | ‐7,248 to ‐6,833 | ‐34.3% to ‐32.3% | ‐8,724 to ‐8,308 | ‐38.6% to ‐36.7% | ‐9,031 to ‐8,615 | ‐39.4% to ‐37.6% |
| March | 22,641 | 24,259 | 17,082 | ‐5,559 | ‐24.6% | ‐7,177 | ‐29.6% | 25,444 | 16,822 | 16,822 | 16,377 | 16,267 | 19,460 | ‐6,374 to ‐5,819 | ‐28.2% to ‐25.7% | ‐816 to ‐260 | ‐4.8% to ‐1.5% | ‐9,178 to ‐8,622 | ‐36.1% to ‐33.9% |
| April | 21,848 | 23,093 | 1,968 | ‐19,880 | ‐91.0% | ‐21,125 | ‐91.5% | 24,169 | 17,030 | 16,189 | 16,245 | 15,917 | 21,536 | ‐5,932 to ‐4,818 | ‐27.1% to ‐22.1% | 13,949 to 15,062 | 708.8% to 765.4% | ‐8,253 to ‐7,140 | ‐34.1% to ‐29.5% |
| May | 22,480 | 23,870 | 2,070 | ‐20,410 | ‐90.8% | ‐21,801 | ‐91.3% | 24,414 | 18,335 | 17,149 | 17,305 | 16,611 | 22,022 | ‐5,869 to ‐4,145 | ‐26.1% to ‐18.4% | 14,542 to 16,265 | 702.6% to 785.9% | ‐7,802 to ‐6,079 | ‐32.0% to ‐24.9% |
| June | 21,790 | 23,587 | 3,536 | ‐18,254 | ‐83.8% | ‐20,052 | ‐85.0% | 25,010 | 20,065 | 18,670 | 18,748 | 17,526 | 21,497 | ‐4,263 to ‐1,725 | ‐19.6% to ‐7.9% | 13,991 to 16,529 | 395.7% to 467.5% | ‐7,484 to ‐4,945 | ‐29.9% to ‐19.8% |
| July | 24,528 | 25,562 | 5,873 | ‐18,655 | ‐76.1% | ‐19,689 | ‐77.0% | ‐ | ‐ | ‐ | ‐ | ‐ | ‐ | ‐ | ‐ | ‐ | ‐ | ‐ | ‐ |
| August | 23,629 | 24,403 | 7,199 | ‐16,430 | ‐69.5% | ‐17,204 | ‐70.5% | ‐ | ‐ | ‐ | ‐ | ‐ | ‐ | ‐ | ‐ | ‐ | ‐ | ‐ | ‐ |
| September | 22,474 | 23,421 | 8,899 | ‐13,575 | ‐60.4% | ‐14,522 | ‐62.0% | ‐ | ‐ | ‐ | ‐ | ‐ | ‐ | ‐ | ‐ | ‐ | ‐ | ‐ | ‐ |
| October | 23,498 | 24,469 | 12,126 | ‐11,372 | ‐48.4% | ‐12,343 | ‐50.4% | ‐ | ‐ | ‐ | ‐ | ‐ | ‐ | ‐ | ‐ | ‐ | ‐ | ‐ | ‐ |
| November | 22,866 | 23,632 | 13,746 | ‐9,119 | ‐39.9% | ‐9,885 | ‐41.8% | ‐ | ‐ | ‐ | ‐ | ‐ | ‐ | ‐ | ‐ | ‐ | ‐ | ‐ | ‐ |
| December | 24,326 | 25,030 | 16,252 | ‐8,074 | ‐33.2% | ‐8,778 | ‐35.1% | ‐ | ‐ | ‐ | ‐ | ‐ | ‐ | ‐ | ‐ | ‐ | ‐ | ‐ | ‐ |
| 1Q | 67,903 | 71,674 | 64,922 | ‐2,981 | ‐4.4% | ‐6,752 | ‐9.4% | 74,030 | 46,645 | 46,645 | 46,020 | 45,674 | 50,064 | ‐22,229 to ‐21,258 | ‐32.7% to ‐31.3% | ‐19,248 to ‐18,277 | ‐29.6% to ‐28.2% | ‐28,356 to ‐27,385 | ‐38.3% to ‐37.0% |
| 2Q | 66,118 | 70,550 | 7,573 | ‐58,545 | ‐88.5% | ‐62,977 | ‐89.3% | 73,593 | 55,429 | 52,008 | 52,298 | 50,054 | 65,055 | ‐16,064 to ‐10,689 | ‐24.3% to ‐16.2% | 42,481 to 47,856 | 560.9% to 631.9% | ‐23,539 to ‐18,164 | ‐32.0% to ‐24.7% |
| 3Q | 70,631 | 73,385 | 21,971 | ‐48,660 | ‐68.9% | ‐51,415 | ‐70.1% | ‐ | ‐ | ‐ | ‐ | ‐ | ‐ | ‐ | ‐ | ‐ | ‐ | ‐ | ‐ |
| 4Q | 70,689 | 73,131 | 42,124 | ‐28,565 | ‐40.4% | ‐31,007 | ‐42.4% | ‐ | ‐ | ‐ | ‐ | ‐ | ‐ | ‐ | ‐ | ‐ | ‐ | ‐ | ‐ |
| Total | 275,341 | 288,741 | 136,590 | ‐138,751 | ‐50.4% | ‐152,151 | ‐52.7% | 147,623 | 102,074 | 98,653 | 98,318 | 95,728 | 115,119 | ‐38,293 to ‐31,947 | ‐28.6% to ‐23.8% | 23,233 to 29,579 | 32.0% to 40.8% | ‐51,895 to ‐45,549 | ‐35.2% to ‐30.9% |
Passenger number
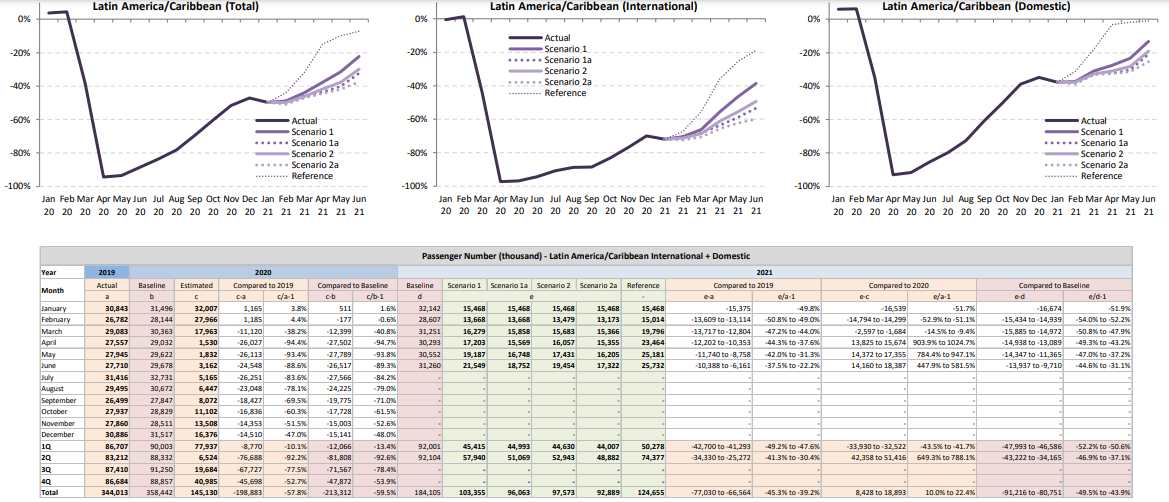
Passenger number
| Passenger Number (thousand) ‐ Latin America/Caribbean International | |||||||||||||||||||
| Year | 2019 | 2020 | 2021 | ||||||||||||||||
| Month | Actual | Baseline | Estimated | Compared to 2019 | Compared to Baseline | Baseline | Scenario 1 | Scenario 1a | Scenario 2 | Scenario 2a | Reference | Compared to 2019 | Compared to 2020 | Compared to Baseline | |||||
| a | b | c | c‐a | c/a‐1 | c‐b | c/b‐1 | d | e | ‐ | e‐a | e/a‐1 | e‐c | e/a‐1 | e‐d | e/d‐1 | ||||
| January | 10,926 | 10,751 | 10,875 | ‐51 | ‐0.5% | 124 | 1.1% | 10,657 | 3,056 | 3,056 | 3,056 | 3,056 | 3,056 | ‐7,870 | ‐72.0% | ‐7,818 | ‐71.9% | ‐7,600 | ‐71.3% |
| February | 9,534 | 9,706 | 9,652 | 118 | 1.2% | ‐54 | ‐0.6% | 9,644 | 3,033 | 3,033 | 2,913 | 2,790 | 3,276 | ‐6,744 to ‐6,501 | ‐70.7% to ‐68.2% | ‐6,862 to ‐6,619 | ‐71.1% to ‐68.6% | ‐6,853 to ‐6,611 | ‐71.1% to ‐68.5% |
| March | 10,830 | 10,670 | 6,066 | ‐4,764 | ‐44.0% | ‐4,605 | ‐43.2% | 10,438 | 3,949 | 3,720 | 3,632 | 3,377 | 5,166 | ‐7,453 to ‐6,882 | ‐68.8% to ‐63.5% | ‐2,688 to ‐2,117 | ‐44.3% to ‐34.9% | ‐7,061 to ‐6,490 | ‐67.6% to ‐62.2% |
| April | 9,833 | 10,171 | 275 | ‐9,558 | ‐97.2% | ‐9,897 | ‐97.3% | 10,408 | 4,682 | 3,835 | 4,064 | 3,598 | 6,705 | ‐6,234 to ‐5,151 | ‐63.4% to ‐52.4% | 3,324 to 4,407 | 1210.9% to 1605.5% | ‐6,810 to ‐5,726 | ‐65.4% to ‐55.0% |
| May | 9,569 | 9,976 | 299 | ‐9,270 | ‐96.9% | ‐9,677 | ‐97.0% | 10,311 | 5,443 | 4,219 | 4,519 | 3,842 | 7,223 | ‐5,727 to ‐4,126 | ‐59.8% to ‐43.1% | 3,543 to 5,144 | 1184.9% to 1720.3% | ‐6,469 to ‐4,868 | ‐62.7% to ‐47.2% |
| June | 9,808 | 10,168 | 554 | ‐9,253 | ‐94.3% | ‐9,614 | ‐94.5% | 10,418 | 6,395 | 4,880 | 5,256 | 4,190 | 8,061 | ‐5,618 to ‐3,413 | ‐57.3% to ‐34.8% | 3,635 to 5,841 | 655.6% to 1053.4% | ‐6,228 to ‐4,023 | ‐59.8% to ‐38.6% |
| July | 10,759 | 11,055 | 988 | ‐9,771 | ‐90.8% | ‐10,067 | ‐91.1% | ‐ | ‐ | ‐ | ‐ | ‐ | ‐ | ‐ | ‐ | ‐ | ‐ | ‐ | ‐ |
| August | 10,182 | 10,587 | 1,155 | ‐9,027 | ‐88.7% | ‐9,432 | ‐89.1% | ‐ | ‐ | ‐ | ‐ | ‐ | ‐ | ‐ | ‐ | ‐ | ‐ | ‐ | ‐ |
| September | 8,413 | 8,868 | 970 | ‐7,443 | ‐88.5% | ‐7,898 | ‐89.1% | ‐ | ‐ | ‐ | ‐ | ‐ | ‐ | ‐ | ‐ | ‐ | ‐ | ‐ | ‐ |
| October | 8,630 | 8,599 | 1,460 | ‐7,170 | ‐83.1% | ‐7,139 | ‐83.0% | ‐ | ‐ | ‐ | ‐ | ‐ | ‐ | ‐ | ‐ | ‐ | ‐ | ‐ | ‐ |
| November | 9,239 | 9,139 | 2,129 | ‐7,110 | ‐77.0% | ‐7,010 | ‐76.7% | ‐ | ‐ | ‐ | ‐ | ‐ | ‐ | ‐ | ‐ | ‐ | ‐ | ‐ | ‐ |
| December | 10,726 | 10,641 | 3,228 | ‐7,498 | ‐69.9% | ‐7,413 | ‐69.7% | ‐ | ‐ | ‐ | ‐ | ‐ | ‐ | ‐ | ‐ | ‐ | ‐ | ‐ | ‐ |
| 1Q | 31,290 | 31,127 | 26,592 | ‐4,698 | ‐15.0% | ‐4,535 | ‐14.6% | 30,738 | 10,038 | 9,809 | 9,601 | 9,224 | 11,498 | ‐22,066 to ‐21,252 | ‐70.5% to ‐67.9% | ‐17,368 to ‐16,554 | ‐65.3% to ‐62.3% | ‐21,514 to ‐20,700 | ‐70.0% to ‐67.3% |
| 2Q | 29,210 | 30,316 | 1,128 | ‐28,082 | ‐96.1% | ‐29,188 | ‐96.3% | 31,137 | 16,520 | 12,935 | 13,839 | 11,630 | 21,989 | ‐17,580 to ‐12,690 | ‐60.2% to ‐43.4% | 10,502 to 15,392 | 931.0% to 1364.6% | ‐19,507 to ‐14,617 | ‐62.6% to ‐46.9% |
| 3Q | 29,354 | 30,510 | 3,113 | ‐26,240 | ‐89.4% | ‐27,397 | ‐89.8% | ‐ | ‐ | ‐ | ‐ | ‐ | ‐ | ‐ | ‐ | ‐ | ‐ | ‐ | ‐ |
| 4Q | 28,595 | 28,378 | 6,817 | ‐21,778 | ‐76.2% | ‐21,562 | ‐76.0% | ‐ | ‐ | ‐ | ‐ | ‐ | ‐ | ‐ | ‐ | ‐ | ‐ | ‐ | ‐ |
| Total | 118,449 | 120,332 | 37,650 | ‐80,799 | ‐68.2% | ‐82,682 | ‐68.7% | 61,875 | 26,558 | 22,744 | 23,440 | 20,854 | 33,487 | ‐39,646 to ‐33,942 | ‐65.5% to ‐56.1% | ‐6,866 to ‐1,162 | ‐24.8% to ‐4.2% | ‐41,021 to ‐35,317 | ‐66.3% to ‐57.1% |
| Passenger Number (thousand) ‐ Latin America/Caribbean Domestic | |||||||||||||||||||
| Year | 2019 | 2020 | 2021 | ||||||||||||||||
| Month | Actual | Baseline | Estimated | Compared to 2019 | Compared to Baseline | Baseline | Scenario 1 | Scenario 1a | Scenario 2 | Scenario 2a | Reference | Compared to 2019 | Compared to 2020 | Compared to Baseline | |||||
| a | b | c | c‐a | c/a‐1 | c‐b | c/b‐1 | d | e | ‐ | e‐a | e/a‐1 | e‐c | e/a‐1 | e‐d | e/d‐1 | ||||
| January | 19,917 | 20,745 | 21,133 | 1,216 | 6.1% | 387 | 1.9% | 21,486 | 12,412 | 12,412 | 12,412 | 12,412 | 12,412 | ‐7,505 | ‐37.7% | ‐8,721 | ‐41.3% | ‐9,074 | ‐42.2% |
| February | 17,247 | 18,438 | 18,315 | 1,067 | 6.2% | ‐124 | ‐0.7% | 18,963 | 11,335 | 11,335 | 11,181 | 10,982 | 12,184 | ‐6,266 to ‐5,912 | ‐36.3% to ‐34.3% | ‐7,333 to ‐6,979 | ‐40.0% to ‐38.1% | ‐7,982 to ‐7,628 | ‐42.1% to ‐40.2% |
| March | 18,253 | 19,692 | 11,898 | ‐6,355 | ‐34.8% | ‐7,794 | ‐39.6% | 20,813 | 13,217 | 12,998 | 12,817 | 12,701 | 15,594 | ‐5,552 to ‐5,036 | ‐30.4% to ‐27.6% | 803 to 1,319 | 6.7% to 11.1% | ‐8,112 to ‐7,596 | ‐39.0% to ‐36.5% |
| April | 17,724 | 18,860 | 1,255 | ‐16,469 | ‐92.9% | ‐17,605 | ‐93.3% | 19,885 | 13,508 | 12,590 | 12,813 | 12,507 | 17,413 | ‐5,217 to ‐4,215 | ‐29.4% to ‐23.8% | 11,252 to 12,253 | 896.5% to 976.3% | ‐7,378 to ‐6,376 | ‐37.1% to ‐32.1% |
| May | 18,376 | 19,645 | 1,534 | ‐16,843 | ‐91.7% | ‐18,112 | ‐92.2% | 20,241 | 14,693 | 13,486 | 13,779 | 13,170 | 17,990 | ‐5,207 to ‐3,683 | ‐28.3% to ‐20.0% | 11,636 to 13,160 | 758.8% to 858.2% | ‐7,072 to ‐5,548 | ‐34.9% to ‐27.4% |
| June | 17,902 | 19,510 | 2,607 | ‐15,295 | ‐85.4% | ‐16,903 | ‐86.6% | 20,842 | 16,195 | 14,802 | 15,036 | 13,982 | 17,686 | ‐3,920 to ‐1,708 | ‐21.9% to ‐9.5% | 11,374 to 13,587 | 436.2% to 521.1% | ‐6,860 to ‐4,647 | ‐32.9% to ‐22.3% |
| July | 20,657 | 21,676 | 4,176 | ‐16,481 | ‐79.8% | ‐17,499 | ‐80.7% | ‐ | ‐ | ‐ | ‐ | ‐ | ‐ | ‐ | ‐ | ‐ | ‐ | ‐ | ‐ |
| August | 19,314 | 20,085 | 5,293 | ‐14,021 | ‐72.6% | ‐14,793 | ‐73.6% | ‐ | ‐ | ‐ | ‐ | ‐ | ‐ | ‐ | ‐ | ‐ | ‐ | ‐ | ‐ |
| September | 18,086 | 18,979 | 7,103 | ‐10,983 | ‐60.7% | ‐11,876 | ‐62.6% | ‐ | ‐ | ‐ | ‐ | ‐ | ‐ | ‐ | ‐ | ‐ | ‐ | ‐ | ‐ |
| October | 19,307 | 20,231 | 9,642 | ‐9,665 | ‐50.1% | ‐10,589 | ‐52.3% | ‐ | ‐ | ‐ | ‐ | ‐ | ‐ | ‐ | ‐ | ‐ | ‐ | ‐ | ‐ |
| November | 18,622 | 19,372 | 11,379 | ‐7,242 | ‐38.9% | ‐7,993 | ‐41.3% | ‐ | ‐ | ‐ | ‐ | ‐ | ‐ | ‐ | ‐ | ‐ | ‐ | ‐ | ‐ |
| December | 20,160 | 20,876 | 13,149 | ‐7,011 | ‐34.8% | ‐7,728 | ‐37.0% | ‐ | ‐ | ‐ | ‐ | ‐ | ‐ | ‐ | ‐ | ‐ | ‐ | ‐ | ‐ |
| 1Q | 55,417 | 58,876 | 51,345 | ‐4,072 | ‐7.3% | ‐7,531 | ‐12.8% | 61,262 | 36,964 | 36,745 | 36,409 | 36,094 | 40,190 | ‐19,323 to ‐18,453 | ‐34.9% to ‐33.3% | ‐15,251 to ‐14,381 | ‐29.7% to ‐28.0% | ‐25,168 to ‐24,298 | ‐41.1% to ‐39.7% |
| 2Q | 54,002 | 58,016 | 5,396 | ‐48,606 | ‐90.0% | ‐52,620 | ‐90.7% | 60,968 | 44,396 | 40,877 | 41,627 | 39,658 | 53,088 | ‐14,344 to ‐9,606 | ‐26.6% to ‐17.8% | 34,262 to 39,000 | 634.9% to 722.8% | ‐21,310 to ‐16,572 | ‐35.0% to ‐27.2% |
| 3Q | 58,057 | 60,740 | 16,572 | ‐41,485 | ‐71.5% | ‐44,168 | ‐72.7% | ‐ | ‐ | ‐ | ‐ | ‐ | ‐ | ‐ | ‐ | ‐ | ‐ | ‐ | ‐ |
| 4Q | 58,089 | 60,479 | 34,170 | ‐23,919 | ‐41.2% | ‐26,309 | ‐43.5% | ‐ | ‐ | ‐ | ‐ | ‐ | ‐ | ‐ | ‐ | ‐ | ‐ | ‐ | ‐ |
| Total | 225,564 | 238,110 | 107,483 | ‐118,082 | ‐52.3% | ‐130,627 | ‐54.9% | 122,230 | 81,360 | 77,622 | 78,037 | 75,752 | 93,278 | ‐33,667 to ‐28,059 | ‐30.8% to ‐25.6% | 19,011 to 24,619 | 33.5% to 43.4% | ‐46,478 to ‐40,870 | ‐38.0% to ‐33.4% |
Passenger revenue
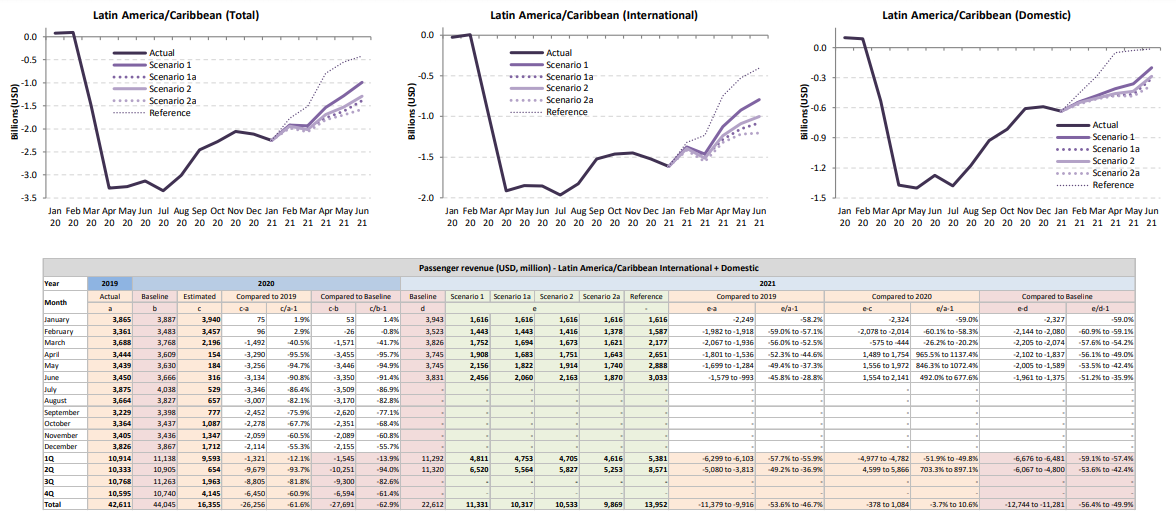
Passenger revenue
| Passenger revenue (USD, million) ‐ Latin America/Caribbean International | |||||||||||||||||||
| Year | 2019 | 2020 | 2021 | ||||||||||||||||
| Month | Actual | Baseline | Estimated | Compared to 2019 | Compared to Baseline | Baseline | Scenario 1 | Scenario 1a | Scenario 2 | Scenario 2a | Reference | Compared to 2019 | Compared to 2020 | Compared to Baseline | |||||
| a | b | c | c‐a | c/a‐1 | c‐b | c/b‐1 | d | e | ‐ | e‐a | e/a‐1 | e‐c | e/a‐1 | e‐d | e/d‐1 | ||||
| January | 2,201 | 2,157 | 2,175 | ‐25 | ‐1.2% | 19 | 0.9% | 2,152 | 587 | 587 | 587 | 587 | 587 | ‐1,614 | ‐73.3% | ‐1,588 | ‐73.0% | ‐1,565 | ‐72.7% |
| February | 1,921 | 1,947 | 1,929 | 9 | 0.5% | ‐17 | ‐0.9% | 1,944 | 583 | 583 | 560 | 536 | 630 | ‐1,385 to ‐1,338 | ‐72.1% to ‐69.6% | ‐1,393 to ‐1,346 | ‐72.2% to ‐69.8% | ‐1,408 to ‐1,361 | ‐72.4% to ‐70.0% |
| March | 2,167 | 2,127 | 1,208 | ‐959 | ‐44.3% | ‐919 | ‐43.2% | 2,092 | 761 | 717 | 699 | 650 | 1,002 | ‐1,517 to ‐1,406 | ‐70.0% to ‐64.9% | ‐558 to ‐447 | ‐46.2% to ‐37.0% | ‐1,442 to ‐1,331 | ‐68.9% to ‐63.6% |
| April | 1,970 | 2,040 | 52 | ‐1,918 | ‐97.3% | ‐1,988 | ‐97.4% | 2,092 | 905 | 740 | 784 | 694 | 1,307 | ‐1,276 to ‐1,065 | ‐64.8% to ‐54.1% | 641 to 853 | 1226.0% to 1630.2% | ‐1,398 to ‐1,187 | ‐66.8% to ‐56.7% |
| May | 1,911 | 1,996 | 59 | ‐1,853 | ‐96.9% | ‐1,938 | ‐97.1% | 2,063 | 1,055 | 815 | 873 | 741 | 1,409 | ‐1,170 to ‐857 | ‐61.2% to ‐44.8% | 683 to 996 | 1163.8% to 1698.3% | ‐1,322 to ‐1,008 | ‐64.1% to ‐48.9% |
| June | 1,962 | 2,043 | 104 | ‐1,858 | ‐94.7% | ‐1,939 | ‐94.9% | 2,098 | 1,243 | 945 | 1,018 | 809 | 1,576 | ‐1,153 to ‐719 | ‐58.8% to ‐36.6% | 705 to 1,139 | 675.5% to 1091.4% | ‐1,288 to ‐855 | ‐61.4% to ‐40.7% |
| July | 2,156 | 2,234 | 190 | ‐1,965 | ‐91.2% | ‐2,044 | ‐91.5% | ‐ | ‐ | ‐ | ‐ | ‐ | ‐ | ‐ | ‐ | ‐ | ‐ | ‐ | ‐ |
| August | 2,057 | 2,154 | 227 | ‐1,830 | ‐89.0% | ‐1,927 | ‐89.5% | ‐ | ‐ | ‐ | ‐ | ‐ | ‐ | ‐ | ‐ | ‐ | ‐ | ‐ | ‐ |
| September | 1,720 | 1,815 | 196 | ‐1,524 | ‐88.6% | ‐1,618 | ‐89.2% | ‐ | ‐ | ‐ | ‐ | ‐ | ‐ | ‐ | ‐ | ‐ | ‐ | ‐ | ‐ |
| October | 1,754 | 1,753 | 292 | ‐1,462 | ‐83.3% | ‐1,460 | ‐83.3% | ‐ | ‐ | ‐ | ‐ | ‐ | ‐ | ‐ | ‐ | ‐ | ‐ | ‐ | ‐ |
| November | 1,855 | 1,825 | 406 | ‐1,449 | ‐78.1% | ‐1,419 | ‐77.8% | ‐ | ‐ | ‐ | ‐ | ‐ | ‐ | ‐ | ‐ | ‐ | ‐ | ‐ | ‐ |
| December | 2,145 | 2,129 | 621 | ‐1,524 | ‐71.0% | ‐1,508 | ‐70.8% | ‐ | ‐ | ‐ | ‐ | ‐ | ‐ | ‐ | ‐ | ‐ | ‐ | ‐ | ‐ |
| 1Q | 6,288 | 6,231 | 5,313 | ‐976 | ‐15.5% | ‐918 | ‐14.7% | 6,188 | 1,931 | 1,887 | 1,846 | 1,773 | 2,219 | ‐4,515 to ‐4,357 | ‐71.8% to ‐69.3% | ‐3,540 to ‐3,382 | ‐66.6% to ‐63.7% | ‐4,415 to ‐4,256 | ‐71.3% to ‐68.8% |
| 2Q | 5,844 | 6,080 | 215 | ‐5,628 | ‐96.3% | ‐5,864 | ‐96.5% | 6,252 | 3,203 | 2,499 | 2,676 | 2,244 | 4,293 | ‐3,600 to ‐2,641 | ‐61.6% to ‐45.2% | 2,029 to 2,988 | 942.3% to 1387.6% | ‐4,008 to ‐3,049 | ‐64.1% to ‐48.8% |
| 3Q | 5,932 | 6,202 | 613 | ‐5,319 | ‐89.7% | ‐5,589 | ‐90.1% | ‐ | ‐ | ‐ | ‐ | ‐ | ‐ | ‐ | ‐ | ‐ | ‐ | ‐ | ‐ |
| 4Q | 5,754 | 5,707 | 1,319 | ‐4,434 | ‐77.1% | ‐4,387 | ‐76.9% | ‐ | ‐ | ‐ | ‐ | ‐ | ‐ | ‐ | ‐ | ‐ | ‐ | ‐ | ‐ |
| Total | 23,818 | 24,220 | 7,461 | ‐16,358 | ‐68.7% | ‐16,759 | ‐69.2% | 12,440 | 5,134 | 4,386 | 4,522 | 4,017 | 6,511 | ‐8,115 to ‐6,998 | ‐66.9% to ‐57.7% | ‐1,511 to ‐394 | ‐27.3% to ‐7.1% | ‐8,423 to ‐7,306 | ‐67.7% to ‐58.7% |
| Passenger revenue (USD, million) ‐ Latin America/Caribbean Domestic | |||||||||||||||||||
| Year | 2019 | 2020 | 2021 | ||||||||||||||||
| Month | Actual | Baseline | Estimated | Compared to 2019 | Compared to Baseline | Baseline | Scenario 1 | Scenario 1a | Scenario 2 | Scenario 2a | Reference | Compared to 2019 | Compared to 2020 | Compared to Baseline | |||||
| a | b | c | c‐a | c/a‐1 | c‐b | c/b‐1 | d | e | ‐ | e‐a | e/a‐1 | e‐c | e/a‐1 | e‐d | e/d‐1 | ||||
| January | 1,664 | 1,731 | 1,765 | 100 | 6.0% | 34 | 2.0% | 1,791 | 1,029 | 1,029 | 1,029 | 1,029 | 1,029 | ‐635 | ‐38.2% | ‐735 | ‐41.7% | ‐762 | ‐42.5% |
| February | 1,440 | 1,536 | 1,527 | 87 | 6.1% | ‐9 | ‐0.6% | 1,579 | 940 | 940 | 927 | 911 | 1,011 | ‐529 to ‐500 | ‐36.7% to ‐34.7% | ‐616 to ‐587 | ‐40.4% to ‐38.4% | ‐668 to ‐639 | ‐42.3% to ‐40.5% |
| March | 1,522 | 1,640 | 988 | ‐533 | ‐35.0% | ‐652 | ‐39.7% | 1,734 | 1,096 | 1,078 | 1,063 | 1,053 | 1,294 | ‐468 to ‐425 | ‐30.8% to ‐27.9% | 65 to 108 | 6.6% to 10.9% | ‐681 to ‐638 | ‐39.2% to ‐36.8% |
| April | 1,474 | 1,569 | 102 | ‐1,372 | ‐93.1% | ‐1,467 | ‐93.5% | 1,653 | 1,121 | 1,044 | 1,063 | 1,037 | 1,445 | ‐437 to ‐354 | ‐29.6% to ‐24.0% | 936 to 1,019 | 918.0% to 999.7% | ‐616 to ‐532 | ‐37.2% to ‐32.2% |
| May | 1,528 | 1,634 | 125 | ‐1,403 | ‐91.8% | ‐1,509 | ‐92.3% | 1,682 | 1,219 | 1,119 | 1,143 | 1,092 | 1,493 | ‐436 to ‐309 | ‐28.5% to ‐20.2% | 967 to 1,094 | 772.4% to 873.5% | ‐590 to ‐463 | ‐35.1% to ‐27.5% |
| June | 1,487 | 1,622 | 212 | ‐1,276 | ‐85.8% | ‐1,411 | ‐87.0% | 1,733 | 1,344 | 1,228 | 1,247 | 1,160 | 1,468 | ‐328 to ‐144 | ‐22.0% to ‐9.7% | 948 to 1,132 | 448.3% to 535.2% | ‐573 to ‐390 | ‐33.1% to ‐22.5% |
| July | 1,719 | 1,804 | 339 | ‐1,381 | ‐80.3% | ‐1,466 | ‐81.2% | ‐ | ‐ | ‐ | ‐ | ‐ | ‐ | ‐ | ‐ | ‐ | ‐ | ‐ | ‐ |
| August | 1,607 | 1,673 | 430 | ‐1,177 | ‐73.2% | ‐1,243 | ‐74.3% | ‐ | ‐ | ‐ | ‐ | ‐ | ‐ | ‐ | ‐ | ‐ | ‐ | ‐ | ‐ |
| September | 1,509 | 1,583 | 581 | ‐928 | ‐61.5% | ‐1,002 | ‐63.3% | ‐ | ‐ | ‐ | ‐ | ‐ | ‐ | ‐ | ‐ | ‐ | ‐ | ‐ | ‐ |
| October | 1,610 | 1,684 | 794 | ‐816 | ‐50.7% | ‐890 | ‐52.8% | ‐ | ‐ | ‐ | ‐ | ‐ | ‐ | ‐ | ‐ | ‐ | ‐ | ‐ | ‐ |
| November | 1,551 | 1,611 | 941 | ‐610 | ‐39.3% | ‐670 | ‐41.6% | ‐ | ‐ | ‐ | ‐ | ‐ | ‐ | ‐ | ‐ | ‐ | ‐ | ‐ | ‐ |
| December | 1,681 | 1,737 | 1,091 | ‐590 | ‐35.1% | ‐647 | ‐37.2% | ‐ | ‐ | ‐ | ‐ | ‐ | ‐ | ‐ | ‐ | ‐ | ‐ | ‐ | ‐ |
| 1Q | 4,626 | 4,908 | 4,280 | ‐346 | ‐7.5% | ‐627 | ‐12.8% | 5,104 | 3,066 | 3,048 | 3,020 | 2,994 | 3,334 | ‐1,632 to ‐1,560 | ‐35.3% to ‐33.7% | ‐1,287 to ‐1,214 | ‐30.1% to ‐28.4% | ‐2,111 to ‐2,039 | ‐41.4% to ‐39.9% |
| 2Q | 4,490 | 4,825 | 439 | ‐4,051 | ‐90.2% | ‐4,387 | ‐90.9% | 5,068 | 3,683 | 3,391 | 3,453 | 3,290 | 4,407 | ‐1,200 to ‐806 | ‐26.7% to ‐18.0% | 2,851 to 3,245 | 649.9% to 739.7% | ‐1,779 to ‐1,385 | ‐35.1% to ‐27.3% |
| 3Q | 4,835 | 5,060 | 1,349 | ‐3,486 | ‐72.1% | ‐3,711 | ‐73.3% | ‐ | ‐ | ‐ | ‐ | ‐ | ‐ | ‐ | ‐ | ‐ | ‐ | ‐ | ‐ |
| 4Q | 4,842 | 5,033 | 2,826 | ‐2,016 | ‐41.6% | ‐2,207 | ‐43.8% | ‐ | ‐ | ‐ | ‐ | ‐ | ‐ | ‐ | ‐ | ‐ | ‐ | ‐ | ‐ |
| Total | 18,792 | 19,826 | 8,894 | ‐9,898 | ‐52.7% | ‐10,932 | ‐55.1% | 10,173 | 6,749 | 6,439 | 6,473 | 6,283 | 7,741 | ‐2,832 to ‐2,366 | ‐31.1% to ‐26.0% | 1,564 to 2,030 | 33.2% to 43.0% | ‐3,890 to ‐3,423 | ‐38.2% to ‐33.7% |
| Compared to 2019 | Seat capacity (%) | Passenger number (thousand) | Passenger revenue (USD, million) | |||||||||
| Total | International | Domestic | Total | International | Domestic | Total | International | Domestic | ||||
| 1Q 2020 | ‐15.8% | ‐14.8% | ‐19.1% | ‐8,127 | ‐18.3% | ‐5,982 | ‐17.3% | ‐2,145 | ‐21.7% | ‐1,243 | ‐1,040 | ‐203 |
| 2Q 2020 | ‐89.4% | ‐89.7% | ‐88.2% | ‐43,712 | ‐95.5% | ‐34,279 | ‐96.1% | ‐9,433 | ‐93.1% | ‐7,184 | ‐6,292 | ‐891 |
| 3Q 2020 | ‐72.8% | ‐77.9% | ‐53.7% | ‐44,476 | ‐86.5% | ‐36,766 | ‐90.1% | ‐7,710 | ‐72.6% | ‐7,451 | ‐6,722 | ‐729 |
| 4Q 2020 | ‐60.0% | ‐67.8% | ‐30.7% | ‐35,347 | ‐78.0% | ‐30,093 | ‐83.7% | ‐5,253 | ‐56.1% | ‐6,023 | ‐5,526 | ‐496 |
| Total 2020 | ‐59.7% | ‐62.9% | ‐48.0% | ‐131,662 | ‐70.4% | ‐107,121 | ‐72.9% | ‐24,541 | ‐61.4% | ‐21,900 | ‐19,581 | ‐2,319 |
| 1Q 2021 | ‐58.8% to ‐57.9% | ‐66.0% to ‐65.0% | ‐34.1% to ‐33.5% | ‐33,526 to ‐32,499 | ‐75.5% to ‐73.2% | ‐27,895 to ‐27,191 | ‐80.9% to ‐78.8% | ‐5,632 to ‐5,308 | ‐57.0% to ‐53.7% | ‐5,634 to ‐5,472 | ‐5,102 to ‐4,970 | ‐532 to ‐502 |
| 2Q 2021 | ‐49.9% to ‐41.6% | ‐56.8% to ‐47.2% | ‐25.9% to ‐22.0% | ‐31,464 to ‐25,060 | ‐68.7% to ‐54.7% | ‐26,462 to ‐21,577 | ‐74.2% to ‐60.5% | ‐5,002 to ‐3,482 | ‐49.4% to ‐34.4% | ‐5,318 to ‐4,263 | ‐4,845 to ‐3,934 | ‐473 to ‐329 |
| 3Q 2021 | ‐ | ‐ | ‐ | ‐ | ‐ | ‐ | ‐ | ‐ | ‐ | ‐ | ‐ | ‐ |
| 4Q 2021 | ‐ | ‐ | ‐ | ‐ | ‐ | ‐ | ‐ | ‐ | ‐ | ‐ | ‐ | ‐ |
| Total 1Q/2Q 2021 | ‐54.4% to ‐49.8% | ‐61.4% to ‐56.1% | ‐30.1% to ‐27.8% | ‐64,991 to ‐57,558 | ‐72.1% to ‐63.8% | ‐54,357 to ‐48,768 | ‐77.5% to ‐69.5% | ‐10,634 to ‐8,790 | ‐53.1% to ‐43.9% | ‐10,953 to ‐9,735 | ‐9,948 to ‐8,904 | ‐1,005 to ‐831 |
Seat capacity
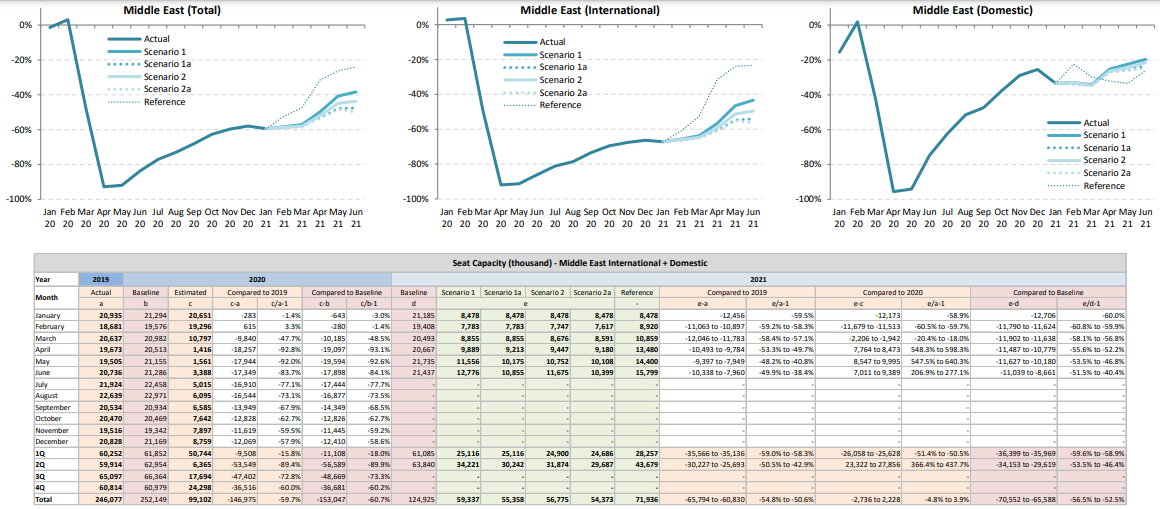
Seat capacity
| Seat Capacity (thousand) ‐ Middle East International | |||||||||||||||||||
| Year | 2019 | 2020 | 2021 | ||||||||||||||||
| Month | Actual | Baseline | Estimated | Compared to 2019 | Compared to Baseline | Baseline | Scenario 1 | Scenario 1a | Scenario 2 | Scenario 2a | Reference | Compared to 2019 | Compared to 2020 | Compared to Baseline | |||||
| a | b | c | c‐a | c/a‐1 | c‐b | c/b‐1 | d | e | ‐ | e‐a | e/a‐1 | e‐c | e/a‐1 | e‐d | e/d‐1 | ||||
| January | 16,184 | 16,864 | 16,636 | 452 | 2.8% | ‐228 | ‐1.4% | 16,907 | 5,311 | 5,311 | 5,311 | 5,311 | 5,311 | ‐10,873 | ‐67.2% | ‐11,325 | ‐68.1% | ‐11,597 | ‐68.6% |
| February | 14,502 | 15,544 | 15,035 | 532 | 3.7% | ‐510 | ‐3.3% | 15,625 | 5,076 | 5,076 | 5,016 | 4,932 | 5,942 | ‐9,570 to ‐9,427 | ‐66.0% to ‐65.0% | ‐10,102 to ‐9,959 | ‐67.2% to ‐66.2% | ‐10,692 to ‐10,549 | ‐68.4% to ‐67.5% |
| March | 16,046 | 16,718 | 8,142 | ‐7,904 | ‐49.3% | ‐8,576 | ‐51.3% | 16,506 | 5,967 | 5,967 | 5,762 | 5,665 | 7,882 | ‐10,381 to ‐10,079 | ‐64.7% to ‐62.8% | ‐2,477 to ‐2,175 | ‐30.4% to ‐26.7% | ‐10,841 to ‐10,539 | ‐65.7% to ‐63.8% |
| April | 15,327 | 16,198 | 1,227 | ‐14,100 | ‐92.0% | ‐14,971 | ‐92.4% | 16,490 | 6,812 | 6,174 | 6,357 | 6,089 | 10,870 | ‐9,238 to ‐8,515 | ‐60.3% to ‐55.6% | 4,862 to 5,585 | 396.4% to 455.3% | ‐10,401 to ‐9,678 | ‐63.1% to ‐58.7% |
| May | 14,928 | 16,610 | 1,292 | ‐13,635 | ‐91.3% | ‐15,318 | ‐92.2% | 17,361 | 8,233 | 6,948 | 7,432 | 6,820 | 11,583 | ‐8,108 to ‐6,695 | ‐54.3% to ‐44.8% | 5,528 to 6,940 | 427.7% to 537.0% | ‐10,541 to ‐9,128 | ‐60.7% to ‐52.6% |
| June | 16,376 | 16,956 | 2,281 | ‐14,095 | ‐86.1% | ‐14,675 | ‐86.5% | 17,311 | 9,566 | 7,721 | 8,440 | 7,254 | 12,407 | ‐9,122 to ‐6,809 | ‐55.7% to ‐41.6% | 4,973 to 7,285 | 218.0% to 319.4% | ‐10,058 to ‐7,745 | ‐58.1% to ‐44.7% |
| July | 17,335 | 17,901 | 3,280 | ‐14,054 | ‐81.1% | ‐14,621 | ‐81.7% | ‐ | ‐ | ‐ | ‐ | ‐ | ‐ | ‐ | ‐ | ‐ | ‐ | ‐ | ‐ |
| August | 18,009 | 18,374 | 3,845 | ‐14,164 | ‐78.6% | ‐14,529 | ‐79.1% | ‐ | ‐ | ‐ | ‐ | ‐ | ‐ | ‐ | ‐ | ‐ | ‐ | ‐ | ‐ |
| September | 16,148 | 16,579 | 4,276 | ‐11,872 | ‐73.5% | ‐12,303 | ‐74.2% | ‐ | ‐ | ‐ | ‐ | ‐ | ‐ | ‐ | ‐ | ‐ | ‐ | ‐ | ‐ |
| October | 16,072 | 16,533 | 4,897 | ‐11,175 | ‐69.5% | ‐11,636 | ‐70.4% | ‐ | ‐ | ‐ | ‐ | ‐ | ‐ | ‐ | ‐ | ‐ | ‐ | ‐ | ‐ |
| November | 15,440 | 15,714 | 4,998 | ‐10,441 | ‐67.6% | ‐10,716 | ‐68.2% | ‐ | ‐ | ‐ | ‐ | ‐ | ‐ | ‐ | ‐ | ‐ | ‐ | ‐ | ‐ |
| December | 16,544 | 17,231 | 5,564 | ‐10,980 | ‐66.4% | ‐11,667 | ‐67.7% | ‐ | ‐ | ‐ | ‐ | ‐ | ‐ | ‐ | ‐ | ‐ | ‐ | ‐ | ‐ |
| 1Q | 46,732 | 49,127 | 39,813 | ‐6,919 | ‐14.8% | ‐9,314 | ‐19.0% | 49,038 | 16,353 | 16,353 | 16,089 | 15,908 | 19,135 | ‐30,824 to ‐30,379 | ‐66.0% to ‐65.0% | ‐23,905 to ‐23,460 | ‐60.0% to ‐58.9% | ‐33,130 to ‐32,685 | ‐67.6% to ‐66.7% |
| 2Q | 46,630 | 49,764 | 4,800 | ‐41,830 | ‐89.7% | ‐44,964 | ‐90.4% | 51,162 | 24,611 | 20,843 | 22,228 | 20,162 | 34,860 | ‐26,468 to ‐22,019 | ‐56.8% to ‐47.2% | 15,363 to 19,811 | 320.1% to 412.7% | ‐31,000 to ‐26,551 | ‐60.6% to ‐51.9% |
| 3Q | 51,491 | 52,854 | 11,402 | ‐40,090 | ‐77.9% | ‐41,453 | ‐78.4% | ‐ | ‐ | ‐ | ‐ | ‐ | ‐ | ‐ | ‐ | ‐ | ‐ | ‐ | ‐ |
| 4Q | 48,055 | 49,478 | 15,459 | ‐32,596 | ‐67.8% | ‐34,019 | ‐68.8% | ‐ | ‐ | ‐ | ‐ | ‐ | ‐ | ‐ | ‐ | ‐ | ‐ | ‐ | ‐ |
| Total | 192,909 | 201,223 | 71,474 | ‐121,435 | ‐62.9% | ‐129,749 | ‐64.5% | 100,200 | 40,965 | 37,197 | 38,317 | 36,071 | 53,996 | ‐57,291 to ‐52,398 | ‐61.4% to ‐56.1% | ‐8,542 to ‐3,648 | ‐19.1% to ‐8.2% | ‐64,129 to ‐59,235 | ‐64.0% to ‐59.1% |
| Seat Capacity (thousand) ‐ Middle East Domestic | |||||||||||||||||||
| Year | 2019 | 2020 | 2021 | ||||||||||||||||
| Month | Actual | Baseline | Estimated | Compared to 2019 | Compared to Baseline | Baseline | Scenario 1 | Scenario 1a | Scenario 2 | Scenario 2a | Reference | Compared to 2019 | Compared to 2020 | Compared to Baseline | |||||
| a | b | c | c‐a | c/a‐1 | c‐b | c/b‐1 | d | e | ‐ | e‐a | e/a‐1 | e‐c | e/a‐1 | e‐d | e/d‐1 | ||||
| January | 4,751 | 4,430 | 4,015 | ‐736 | ‐15.5% | ‐415 | ‐9.4% | 4,277 | 3,167 | 3,167 | 3,167 | 3,167 | 3,167 | ‐1,584 | ‐33.3% | ‐848 | ‐21.1% | ‐1,110 | ‐25.9% |
| February | 4,178 | 4,032 | 4,261 | 83 | 2.0% | 230 | 5.7% | 3,783 | 2,804 | 2,804 | 2,792 | 2,745 | 3,256 | ‐1,433 to ‐1,374 | ‐34.3% to ‐32.9% | ‐1,516 to ‐1,457 | ‐35.6% to ‐34.2% | ‐1,037 to ‐979 | ‐27.4% to ‐25.9% |
| March | 4,591 | 4,263 | 2,655 | ‐1,936 | ‐42.2% | ‐1,609 | ‐37.7% | 3,987 | 3,025 | 3,025 | 2,999 | 2,994 | 3,211 | ‐1,597 to ‐1,566 | ‐34.8% to ‐34.1% | 339 to 370 | 12.8% to 13.9% | ‐993 to ‐962 | ‐24.9% to ‐24.1% |
| April | 4,346 | 4,316 | 189 | ‐4,157 | ‐95.6% | ‐4,126 | ‐95.6% | 4,178 | 3,259 | 3,187 | 3,201 | 3,176 | 2,843 | ‐1,170 to ‐1,088 | ‐26.9% to ‐25.0% | 2,987 to 3,069 | 1577.4% to 1620.8% | ‐1,001 to ‐919 | ‐24.0% to ‐22.0% |
| May | 4,577 | 4,545 | 269 | ‐4,308 | ‐94.1% | ‐4,276 | ‐94.1% | 4,374 | 3,571 | 3,407 | 3,470 | 3,395 | 2,944 | ‐1,183 to ‐1,006 | ‐25.8% to ‐22.0% | 3,126 to 3,303 | 1163.5% to 1229.4% | ‐980 to ‐803 | ‐22.4% to ‐18.4% |
| June | 4,361 | 4,330 | 1,107 | ‐3,254 | ‐74.6% | ‐3,223 | ‐74.4% | 4,126 | 3,528 | 3,357 | 3,431 | 3,270 | 2,924 | ‐1,091 to ‐833 | ‐25.0% to ‐19.1% | 2,163 to 2,421 | 195.4% to 218.7% | ‐856 to ‐598 | ‐20.8% to ‐14.5% |
| July | 4,590 | 4,557 | 1,734 | ‐2,855 | ‐62.2% | ‐2,823 | ‐61.9% | ‐ | ‐ | ‐ | ‐ | ‐ | ‐ | ‐ | ‐ | ‐ | ‐ | ‐ | ‐ |
| August | 4,630 | 4,597 | 2,249 | ‐2,381 | ‐51.4% | ‐2,348 | ‐51.1% | ‐ | ‐ | ‐ | ‐ | ‐ | ‐ | ‐ | ‐ | ‐ | ‐ | ‐ | ‐ |
| September | 4,386 | 4,355 | 2,309 | ‐2,077 | ‐47.4% | ‐2,046 | ‐47.0% | ‐ | ‐ | ‐ | ‐ | ‐ | ‐ | ‐ | ‐ | ‐ | ‐ | ‐ | ‐ |
| October | 4,398 | 3,935 | 2,745 | ‐1,653 | ‐37.6% | ‐1,190 | ‐30.2% | ‐ | ‐ | ‐ | ‐ | ‐ | ‐ | ‐ | ‐ | ‐ | ‐ | ‐ | ‐ |
| November | 4,076 | 3,628 | 2,898 | ‐1,178 | ‐28.9% | ‐729 | ‐20.1% | ‐ | ‐ | ‐ | ‐ | ‐ | ‐ | ‐ | ‐ | ‐ | ‐ | ‐ | ‐ |
| December | 4,284 | 3,938 | 3,195 | ‐1,089 | ‐25.4% | ‐743 | ‐18.9% | ‐ | ‐ | ‐ | ‐ | ‐ | ‐ | ‐ | ‐ | ‐ | ‐ | ‐ | ‐ |
| 1Q | 13,520 | 12,725 | 10,931 | ‐2,589 | ‐19.1% | ‐1,794 | ‐14.1% | 12,047 | 8,996 | 8,996 | 8,959 | 8,906 | 9,635 | ‐4,614 to ‐4,524 | ‐34.1% to ‐33.5% | ‐2,025 to ‐1,935 | ‐18.5% to ‐17.7% | ‐3,141 to ‐3,051 | ‐26.1% to ‐25.3% |
| 2Q | 13,284 | 13,190 | 1,565 | ‐11,719 | ‐88.2% | ‐11,625 | ‐88.1% | 12,678 | 10,358 | 9,952 | 10,103 | 9,841 | 8,711 | ‐3,443 to ‐2,926 | ‐25.9% to ‐22.0% | 8,276 to 8,793 | 528.9% to 561.9% | ‐2,837 to ‐2,320 | ‐22.4% to ‐18.3% |
| 3Q | 13,606 | 13,510 | 6,293 | ‐7,313 | ‐53.7% | ‐7,217 | ‐53.4% | ‐ | ‐ | ‐ | ‐ | ‐ | ‐ | ‐ | ‐ | ‐ | ‐ | ‐ | ‐ |
| 4Q | 12,758 | 11,501 | 8,839 | ‐3,920 | ‐30.7% | ‐2,662 | ‐23.1% | ‐ | ‐ | ‐ | ‐ | ‐ | ‐ | ‐ | ‐ | ‐ | ‐ | ‐ | ‐ |
| Total | 53,168 | 50,926 | 27,628 | ‐25,540 | ‐48.0% | ‐23,298 | ‐45.7% | 24,725 | 19,354 | 18,947 | 19,062 | 18,747 | 18,346 | ‐8,057 to ‐7,450 | ‐30.1% to ‐27.8% | 6,251 to 6,858 | 50.0% to 54.9% | ‐5,978 to ‐5,371 | ‐24.2% to ‐21.7% |
Passenger number
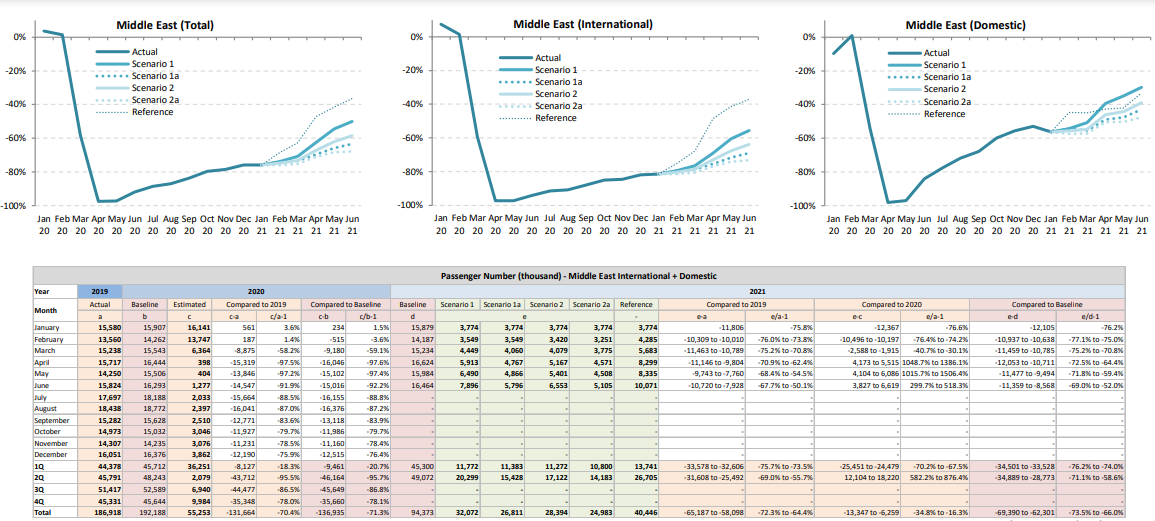
Passenger number
| Passenger Number (thousand) ‐ Middle East International | |||||||||||||||||||
| Year | 2019 | 2020 | 2021 | ||||||||||||||||
| Month | Actual | Baseline | Estimated | Compared to 2019 | Compared to Baseline | Baseline | Scenario 1 | Scenario 1a | Scenario 2 | Scenario 2a | Reference | Compared to 2019 | Compared to 2020 | Compared to Baseline | |||||
| a | b | c | c‐a | c/a‐1 | c‐b | c/b‐1 | d | e | ‐ | e‐a | e/a‐1 | e‐c | e/a‐1 | e‐d | e/d‐1 | ||||
| January | 12,091 | 12,646 | 12,995 | 904 | 7.5% | 349 | 2.8% | 12,724 | 2,251 | 2,251 | 2,251 | 2,251 | 2,251 | ‐9,840 | ‐81.4% | ‐10,744 | ‐82.7% | ‐10,473 | ‐82.3% |
| February | 10,554 | 11,354 | 10,711 | 157 | 1.5% | ‐643 | ‐5.7% | 11,453 | 2,215 | 2,215 | 2,109 | 1,996 | 2,740 | ‐8,558 to ‐8,339 | ‐81.1% to ‐79.0% | ‐8,715 to ‐8,496 | ‐81.4% to ‐79.3% | ‐9,458 to ‐9,239 | ‐82.6% to ‐80.7% |
| March | 11,849 | 12,389 | 4,806 | ‐7,043 | ‐59.4% | ‐7,583 | ‐61.2% | 12,278 | 2,838 | 2,609 | 2,585 | 2,353 | 3,944 | ‐9,497 to ‐9,012 | ‐80.1% to ‐76.1% | ‐2,454 to ‐1,969 | ‐51.0% to ‐41.0% | ‐9,925 to ‐9,440 | ‐80.8% to ‐76.9% |
| April | 12,285 | 13,028 | 335 | ‐11,950 | ‐97.3% | ‐12,693 | ‐97.4% | 13,310 | 3,929 | 3,086 | 3,377 | 2,910 | 6,542 | ‐9,375 to ‐8,356 | ‐76.3% to ‐68.0% | 2,575 to 3,594 | 768.6% to 1072.8% | ‐10,401 to ‐9,382 | ‐78.1% to ‐70.5% |
| May | 10,893 | 12,165 | 303 | ‐10,590 | ‐97.2% | ‐11,862 | ‐97.5% | 12,762 | 4,431 | 3,183 | 3,598 | 2,882 | 6,522 | ‐8,012 to ‐6,462 | ‐73.5% to ‐59.3% | 2,578 to 4,128 | 850.5% to 1361.6% | ‐9,880 to ‐8,331 | ‐77.4% to ‐65.3% |
| June | 12,483 | 12,968 | 744 | ‐11,739 | ‐94.0% | ‐12,224 | ‐94.3% | 13,288 | 5,724 | 3,992 | 4,612 | 3,408 | 7,732 | ‐9,075 to ‐6,759 | ‐72.7% to ‐54.1% | 2,664 to 4,980 | 358.1% to 669.4% | ‐9,880 to ‐7,564 | ‐74.4% to ‐56.9% |
| July | 13,998 | 14,506 | 1,207 | ‐12,791 | ‐91.4% | ‐13,300 | ‐91.7% | ‐ | ‐ | ‐ | ‐ | ‐ | ‐ | ‐ | ‐ | ‐ | ‐ | ‐ | ‐ |
| August | 14,721 | 15,073 | 1,351 | ‐13,370 | ‐90.8% | ‐13,722 | ‐91.0% | ‐ | ‐ | ‐ | ‐ | ‐ | ‐ | ‐ | ‐ | ‐ | ‐ | ‐ | ‐ |
| September | 12,085 | 12,447 | 1,480 | ‐10,605 | ‐87.8% | ‐10,967 | ‐88.1% | ‐ | ‐ | ‐ | ‐ | ‐ | ‐ | ‐ | ‐ | ‐ | ‐ | ‐ | ‐ |
| October | 11,819 | 12,204 | 1,782 | ‐10,037 | ‐84.9% | ‐10,422 | ‐85.4% | ‐ | ‐ | ‐ | ‐ | ‐ | ‐ | ‐ | ‐ | ‐ | ‐ | ‐ | ‐ |
| November | 11,340 | 11,589 | 1,756 | ‐9,584 | ‐84.5% | ‐9,833 | ‐84.8% | ‐ | ‐ | ‐ | ‐ | ‐ | ‐ | ‐ | ‐ | ‐ | ‐ | ‐ | ‐ |
| December | 12,800 | 13,381 | 2,328 | ‐10,473 | ‐81.8% | ‐11,053 | ‐82.6% | ‐ | ‐ | ‐ | ‐ | ‐ | ‐ | ‐ | ‐ | ‐ | ‐ | ‐ | ‐ |
| 1Q | 34,494 | 36,390 | 28,512 | ‐5,982 | ‐17.3% | ‐7,878 | ‐21.6% | 36,455 | 7,304 | 7,075 | 6,945 | 6,600 | 8,936 | ‐27,895 to ‐27,191 | ‐80.9% to ‐78.8% | ‐21,912 to ‐21,208 | ‐76.9% to ‐74.4% | ‐29,855 to ‐29,151 | ‐81.9% to ‐80.0% |
| 2Q | 35,662 | 38,161 | 1,382 | ‐34,279 | ‐96.1% | ‐36,779 | ‐96.4% | 39,360 | 14,084 | 10,261 | 11,587 | 9,199 | 20,795 | ‐26,462 to ‐21,577 | ‐74.2% to ‐60.5% | 7,817 to 12,702 | 565.6% to 919.0% | ‐30,161 to ‐25,276 | ‐76.6% to ‐64.2% |
| 3Q | 40,804 | 42,026 | 4,037 | ‐36,766 | ‐90.1% | ‐37,989 | ‐90.4% | ‐ | ‐ | ‐ | ‐ | ‐ | ‐ | ‐ | ‐ | ‐ | ‐ | ‐ | ‐ |
| 4Q | 35,960 | 37,174 | 5,866 | ‐30,093 | ‐83.7% | ‐31,307 | ‐84.2% | ‐ | ‐ | ‐ | ‐ | ‐ | ‐ | ‐ | ‐ | ‐ | ‐ | ‐ | ‐ |
| Total | 146,919 | 153,751 | 39,798 | ‐107,121 | ‐72.9% | ‐113,953 | ‐74.1% | 75,815 | 21,388 | 17,336 | 18,532 | 15,799 | 29,731 | ‐54,357 to ‐48,768 | ‐77.5% to ‐69.5% | ‐14,095 to ‐8,507 | ‐47.2% to ‐28.5% | ‐60,016 to ‐54,427 | ‐79.2% to ‐71.8% |
| Passenger Number (thousand) ‐ Middle East Domestic | |||||||||||||||||||
| Year | 2019 | 2020 | 2021 | ||||||||||||||||
| Month | Actual | Baseline | Estimated | Compared to 2019 | Compared to Baseline | Baseline | Scenario 1 | Scenario 1a | Scenario 2 | Scenario 2a | Reference | Compared to 2019 | Compared to 2020 | Compared to Baseline | |||||
| a | b | c | c‐a | c/a‐1 | c‐b | c/b‐1 | d | e | ‐ | e‐a | e/a‐1 | e‐c | e/a‐1 | e‐d | e/d‐1 | ||||
| January | 3,489 | 3,260 | 3,146 | ‐343 | ‐9.8% | ‐115 | ‐3.5% | 3,155 | 1,523 | 1,523 | 1,523 | 1,523 | 1,523 | ‐1,966 | ‐56.4% | ‐1,623 | ‐51.6% | ‐1,633 | ‐51.7% |
| February | 3,006 | 2,907 | 3,036 | 30 | 1.0% | 128 | 4.4% | 2,734 | 1,376 | 1,376 | 1,336 | 1,279 | 1,674 | ‐1,727 to ‐1,630 | ‐57.4% to ‐54.2% | ‐1,757 to ‐1,659 | ‐57.9% to ‐54.7% | ‐1,455 to ‐1,358 | ‐53.2% to ‐49.7% |
| March | 3,389 | 3,154 | 1,557 | ‐1,831 | ‐54.0% | ‐1,597 | ‐50.6% | 2,956 | 1,677 | 1,511 | 1,532 | 1,451 | 1,855 | ‐1,938 to ‐1,712 | ‐57.2% to ‐50.5% | ‐107 to 119 | ‐6.9% to 7.7% | ‐1,506 to ‐1,280 | ‐50.9% to ‐43.3% |
| April | 3,432 | 3,416 | 63 | ‐3,369 | ‐98.2% | ‐3,353 | ‐98.2% | 3,314 | 2,090 | 1,755 | 1,849 | 1,702 | 1,891 | ‐1,730 to ‐1,342 | ‐50.4% to ‐39.1% | 1,639 to 2,027 | 2603.3% to 3221.0% | ‐1,612 to ‐1,223 | ‐48.6% to ‐36.9% |
| May | 3,357 | 3,341 | 101 | ‐3,256 | ‐97.0% | ‐3,240 | ‐97.0% | 3,223 | 2,194 | 1,766 | 1,876 | 1,671 | 1,877 | ‐1,686 to ‐1,163 | ‐50.2% to ‐34.6% | 1,570 to 2,093 | 1556.3% to 2074.7% | ‐1,552 to ‐1,029 | ‐48.1% to ‐31.9% |
| June | 3,341 | 3,325 | 533 | ‐2,808 | ‐84.0% | ‐2,792 | ‐84.0% | 3,176 | 2,363 | 1,920 | 2,049 | 1,755 | 2,027 | ‐1,586 to ‐978 | ‐47.5% to ‐29.3% | 1,222 to 1,830 | 229.1% to 343.2% | ‐1,421 to ‐812 | ‐44.7% to ‐25.6% |
| July | 3,699 | 3,682 | 826 | ‐2,873 | ‐77.7% | ‐2,855 | ‐77.6% | ‐ | ‐ | ‐ | ‐ | ‐ | ‐ | ‐ | ‐ | ‐ | ‐ | ‐ | ‐ |
| August | 3,717 | 3,699 | 1,046 | ‐2,671 | ‐71.9% | ‐2,653 | ‐71.7% | ‐ | ‐ | ‐ | ‐ | ‐ | ‐ | ‐ | ‐ | ‐ | ‐ | ‐ | ‐ |
| September | 3,197 | 3,182 | 1,031 | ‐2,166 | ‐67.8% | ‐2,151 | ‐67.6% | ‐ | ‐ | ‐ | ‐ | ‐ | ‐ | ‐ | ‐ | ‐ | ‐ | ‐ | ‐ |
| October | 3,154 | 2,828 | 1,265 | ‐1,889 | ‐59.9% | ‐1,564 | ‐55.3% | ‐ | ‐ | ‐ | ‐ | ‐ | ‐ | ‐ | ‐ | ‐ | ‐ | ‐ | ‐ |
| November | 2,967 | 2,646 | 1,320 | ‐1,647 | ‐55.5% | ‐1,327 | ‐50.1% | ‐ | ‐ | ‐ | ‐ | ‐ | ‐ | ‐ | ‐ | ‐ | ‐ | ‐ | ‐ |
| December | 3,251 | 2,996 | 1,534 | ‐1,717 | ‐52.8% | ‐1,462 | ‐48.8% | ‐ | ‐ | ‐ | ‐ | ‐ | ‐ | ‐ | ‐ | ‐ | ‐ | ‐ | ‐ |
| 1Q | 9,884 | 9,322 | 7,739 | ‐2,145 | ‐21.7% | ‐1,583 | ‐17.0% | 8,845 | 4,576 | 4,410 | 4,390 | 4,252 | 5,051 | ‐5,632 to ‐5,308 | ‐57.0% to ‐53.7% | ‐3,487 to ‐3,163 | ‐45.1% to ‐40.9% | ‐4,593 to ‐4,270 | ‐51.9% to ‐48.3% |
| 2Q | 10,130 | 10,082 | 697 | ‐9,433 | ‐93.1% | ‐9,385 | ‐93.1% | 9,712 | 6,648 | 5,441 | 5,774 | 5,128 | 5,794 | ‐5,002 to ‐3,482 | ‐49.4% to ‐34.4% | 4,431 to 5,951 | 635.6% to 853.7% | ‐4,584 to ‐3,064 | ‐47.2% to ‐31.6% |
| 3Q | 10,613 | 10,563 | 2,903 | ‐7,710 | ‐72.6% | ‐7,660 | ‐72.5% | ‐ | ‐ | ‐ | ‐ | ‐ | ‐ | ‐ | ‐ | ‐ | ‐ | ‐ | ‐ |
| 4Q | 9,372 | 8,470 | 4,118 | ‐5,253 | ‐56.1% | ‐4,352 | ‐51.4% | ‐ | ‐ | ‐ | ‐ | ‐ | ‐ | ‐ | ‐ | ‐ | ‐ | ‐ | ‐ |
| Total | 39,998 | 38,437 | 15,458 | ‐24,541 | ‐61.4% | ‐22,979 | ‐59.8% | 18,557 | 11,224 | 9,851 | 10,164 | 9,380 | 10,845 | ‐10,634 to ‐8,790 | ‐53.1% to ‐43.9% | 944 to 2,787 | 11.2% to 33.0% | ‐9,178 to ‐7,334 | ‐49.5% to ‐39.5% |
Passenger revenue
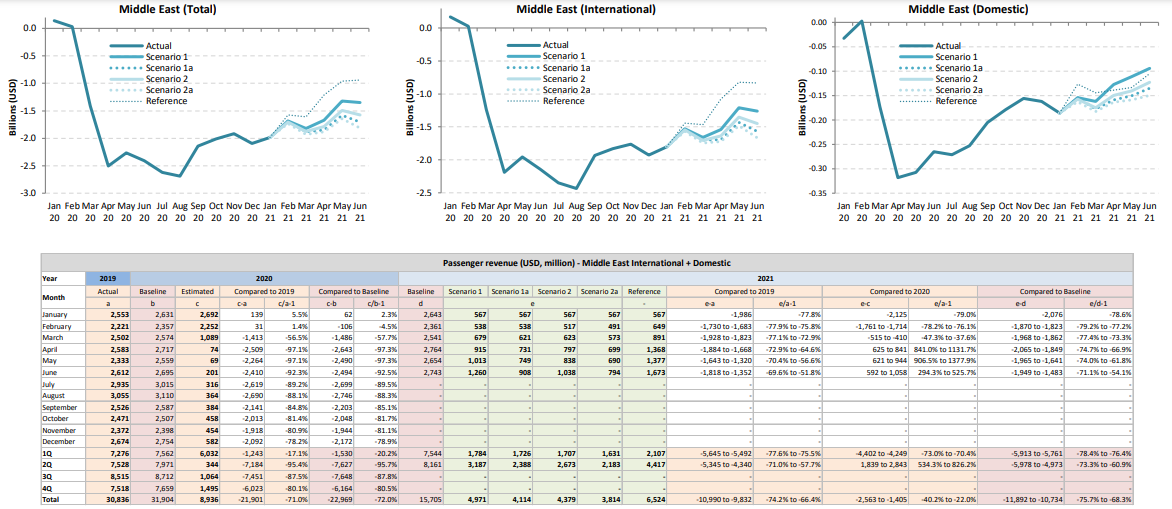
Passenger revenue
| Passenger revenue (USD, million) ‐ Middle East International | |||||||||||||||||||
| Year | 2019 | 2020 | 2021 | ||||||||||||||||
| Month | Actual | Baseline | Estimated | Compared to 2019 | Compared to Baseline | Baseline | Scenario 1 | Scenario 1a | Scenario 2 | Scenario 2a | Reference | Compared to 2019 | Compared to 2020 | Compared to Baseline | |||||
| a | b | c | c‐a | c/a‐1 | c‐b | c/b‐1 | d | e | ‐ | e‐a | e/a‐1 | e‐c | e/a‐1 | e‐d | e/d‐1 | ||||
| January | 2,223 | 2,322 | 2,395 | 172 | 7.7% | 72 | 3.1% | 2,345 | 423 | 423 | 423 | 423 | 423 | ‐1,800 | ‐81.0% | ‐1,972 | ‐82.3% | ‐1,922 | ‐82.0% |
| February | 1,937 | 2,083 | 1,965 | 28 | 1.4% | ‐118 | ‐5.7% | 2,102 | 416 | 416 | 396 | 375 | 514 | ‐1,562 to ‐1,521 | ‐80.6% to ‐78.5% | ‐1,590 to ‐1,549 | ‐80.9% to ‐78.8% | ‐1,727 to ‐1,686 | ‐82.2% to ‐80.2% |
| March | 2,181 | 2,276 | 941 | ‐1,240 | ‐56.8% | ‐1,335 | ‐58.6% | 2,261 | 532 | 490 | 485 | 442 | 738 | ‐1,740 to ‐1,649 | ‐79.8% to ‐75.6% | ‐500 to ‐409 | ‐53.1% to ‐43.4% | ‐1,820 to ‐1,729 | ‐80.5% to ‐76.5% |
| April | 2,259 | 2,394 | 68 | ‐2,190 | ‐97.0% | ‐2,326 | ‐97.1% | 2,451 | 736 | 579 | 633 | 546 | 1,221 | ‐1,713 to ‐1,522 | ‐75.8% to ‐67.4% | 478 to 668 | 698.9% to 977.7% | ‐1,905 to ‐1,714 | ‐77.7% to ‐69.9% |
| May | 2,016 | 2,243 | 59 | ‐1,957 | ‐97.1% | ‐2,184 | ‐97.4% | 2,350 | 830 | 597 | 674 | 540 | 1,217 | ‐1,475 to ‐1,186 | ‐73.2% to ‐58.8% | 481 to 771 | 815.7% to 1306.1% | ‐1,809 to ‐1,520 | ‐77.0% to ‐64.7% |
| June | 2,296 | 2,381 | 151 | ‐2,145 | ‐93.4% | ‐2,230 | ‐93.7% | 2,442 | 1,070 | 748 | 863 | 639 | 1,442 | ‐1,657 to ‐1,226 | ‐72.2% to ‐53.4% | 488 to 919 | 323.3% to 609.2% | ‐1,804 to ‐1,372 | ‐73.8% to ‐56.2% |
| July | 2,585 | 2,667 | 238 | ‐2,348 | ‐90.8% | ‐2,429 | ‐91.1% | ‐ | ‐ | ‐ | ‐ | ‐ | ‐ | ‐ | ‐ | ‐ | ‐ | ‐ | ‐ |
| August | 2,703 | 2,761 | 265 | ‐2,438 | ‐90.2% | ‐2,495 | ‐90.4% | ‐ | ‐ | ‐ | ‐ | ‐ | ‐ | ‐ | ‐ | ‐ | ‐ | ‐ | ‐ |
| September | 2,223 | 2,286 | 287 | ‐1,937 | ‐87.1% | ‐1,999 | ‐87.5% | ‐ | ‐ | ‐ | ‐ | ‐ | ‐ | ‐ | ‐ | ‐ | ‐ | ‐ | ‐ |
| October | 2,173 | 2,239 | 339 | ‐1,834 | ‐84.4% | ‐1,900 | ‐84.9% | ‐ | ‐ | ‐ | ‐ | ‐ | ‐ | ‐ | ‐ | ‐ | ‐ | ‐ | ‐ |
| November | 2,092 | 2,148 | 329 | ‐1,762 | ‐84.3% | ‐1,819 | ‐84.7% | ‐ | ‐ | ‐ | ‐ | ‐ | ‐ | ‐ | ‐ | ‐ | ‐ | ‐ | ‐ |
| December | 2,367 | 2,471 | 437 | ‐1,930 | ‐81.5% | ‐2,034 | ‐82.3% | ‐ | ‐ | ‐ | ‐ | ‐ | ‐ | ‐ | ‐ | ‐ | ‐ | ‐ | ‐ |
| 1Q | 6,341 | 6,681 | 5,301 | ‐1,040 | ‐16.4% | ‐1,380 | ‐20.7% | 6,708 | 1,371 | 1,328 | 1,304 | 1,239 | 1,675 | ‐5,102 to ‐4,970 | ‐80.5% to ‐78.4% | ‐4,062 to ‐3,930 | ‐76.6% to ‐74.1% | ‐5,469 to ‐5,337 | ‐81.5% to ‐79.6% |
| 2Q | 6,570 | 7,018 | 278 | ‐6,292 | ‐95.8% | ‐6,740 | ‐96.0% | 7,243 | 2,637 | 1,924 | 2,171 | 1,725 | 3,880 | ‐4,845 to ‐3,934 | ‐73.7% to ‐59.9% | 1,447 to 2,358 | 519.9% to 847.5% | ‐5,518 to ‐4,606 | ‐76.2% to ‐63.6% |
| 3Q | 7,512 | 7,714 | 790 | ‐6,722 | ‐89.5% | ‐6,924 | ‐89.8% | ‐ | ‐ | ‐ | ‐ | ‐ | ‐ | ‐ | ‐ | ‐ | ‐ | ‐ | ‐ |
| 4Q | 6,632 | 6,859 | 1,105 | ‐5,526 | ‐83.3% | ‐5,753 | ‐83.9% | ‐ | ‐ | ‐ | ‐ | ‐ | ‐ | ‐ | ‐ | ‐ | ‐ | ‐ | ‐ |
| Total | 27,056 | 28,272 | 7,475 | ‐19,581 | ‐72.4% | ‐20,797 | ‐73.6% | 13,951 | 4,008 | 3,252 | 3,475 | 2,964 | 5,555 | ‐9,948 to ‐8,904 | ‐77.0% to ‐69.0% | ‐2,615 to ‐1,572 | ‐46.9% to ‐28.2% | ‐10,987 to ‐9,944 | ‐78.8% to ‐71.3% |
| Passenger revenue (USD, million) ‐ Middle East Domestic | |||||||||||||||||||
| Year | 2019 | 2020 | 2021 | ||||||||||||||||
| Month | Actual | Baseline | Estimated | Compared to 2019 | Compared to Baseline | Baseline | Scenario 1 | Scenario 1a | Scenario 2 | Scenario 2a | Reference | Compared to 2019 | Compared to 2020 | Compared to Baseline | |||||
| a | b | c | c‐a | c/a‐1 | c‐b | c/b‐1 | d | e | ‐ | e‐a | e/a‐1 | e‐c | e/a‐1 | e‐d | e/d‐1 | ||||
| January | 330 | 308 | 297 | ‐32 | ‐9.8% | ‐11 | ‐3.5% | 298 | 144 | 144 | 144 | 144 | 144 | ‐186 | ‐56.4% | ‐153 | ‐51.6% | ‐154 | ‐51.7% |
| February | 284 | 275 | 287 | 3 | 1.0% | 12 | 4.4% | 258 | 130 | 130 | 126 | 121 | 158 | ‐163 to ‐154 | ‐57.4% to ‐54.2% | ‐166 to ‐157 | ‐57.9% to ‐54.7% | ‐137 to ‐128 | ‐53.2% to ‐49.7% |
| March | 320 | 298 | 147 | ‐173 | ‐54.0% | ‐151 | ‐50.6% | 279 | 158 | 143 | 145 | 137 | 175 | ‐183 to ‐162 | ‐57.2% to ‐50.5% | ‐10 to 11 | ‐6.9% to 7.7% | ‐142 to ‐121 | ‐50.9% to ‐43.3% |
| April | 324 | 323 | 6 | ‐318 | ‐98.2% | ‐317 | ‐98.2% | 313 | 198 | 166 | 175 | 161 | 179 | ‐164 to ‐127 | ‐50.4% to ‐39.1% | 155 to 192 | 2603.3% to 3221.0% | ‐152 to ‐116 | ‐48.6% to ‐36.9% |
| May | 317 | 316 | 10 | ‐308 | ‐97.0% | ‐306 | ‐97.0% | 305 | 207 | 167 | 177 | 158 | 177 | ‐159 to ‐110 | ‐50.2% to ‐34.6% | 148 to 198 | 1556.3% to 2074.7% | ‐147 to ‐97 | ‐48.1% to ‐31.9% |
| June | 316 | 314 | 50 | ‐265 | ‐84.0% | ‐264 | ‐84.0% | 300 | 223 | 181 | 194 | 166 | 192 | ‐150 to ‐92 | ‐47.5% to ‐29.3% | 115 to 173 | 229.1% to 343.2% | ‐134 to ‐77 | ‐44.7% to ‐25.6% |
| July | 350 | 348 | 78 | ‐272 | ‐77.7% | ‐270 | ‐77.6% | ‐ | ‐ | ‐ | ‐ | ‐ | ‐ | ‐ | ‐ | ‐ | ‐ | ‐ | ‐ |
| August | 351 | 350 | 99 | ‐252 | ‐71.9% | ‐251 | ‐71.7% | ‐ | ‐ | ‐ | ‐ | ‐ | ‐ | ‐ | ‐ | ‐ | ‐ | ‐ | ‐ |
| September | 302 | 301 | 97 | ‐205 | ‐67.8% | ‐203 | ‐67.6% | ‐ | ‐ | ‐ | ‐ | ‐ | ‐ | ‐ | ‐ | ‐ | ‐ | ‐ | ‐ |
| October | 298 | 267 | 120 | ‐179 | ‐59.9% | ‐148 | ‐55.3% | ‐ | ‐ | ‐ | ‐ | ‐ | ‐ | ‐ | ‐ | ‐ | ‐ | ‐ | ‐ |
| November | 280 | 250 | 125 | ‐156 | ‐55.5% | ‐125 | ‐50.1% | ‐ | ‐ | ‐ | ‐ | ‐ | ‐ | ‐ | ‐ | ‐ | ‐ | ‐ | ‐ |
| December | 307 | 283 | 145 | ‐162 | ‐52.8% | ‐138 | ‐48.8% | ‐ | ‐ | ‐ | ‐ | ‐ | ‐ | ‐ | ‐ | ‐ | ‐ | ‐ | ‐ |
| 1Q | 934 | 881 | 731 | ‐203 | ‐21.7% | ‐150 | ‐17.0% | 836 | 432 | 417 | 415 | 402 | 477 | ‐532 to ‐502 | ‐57.0% to ‐53.7% | ‐330 to ‐299 | ‐45.1% to ‐40.9% | ‐434 to ‐404 | ‐51.9% to ‐48.3% |
| 2Q | 957 | 953 | 66 | ‐891 | ‐93.1% | ‐887 | ‐93.1% | 918 | 628 | 514 | 546 | 485 | 548 | ‐473 to ‐329 | ‐49.4% to ‐34.4% | 419 to 562 | 635.6% to 853.7% | ‐433 to ‐290 | ‐47.2% to ‐31.6% |
| 3Q | 1,003 | 998 | 274 | ‐729 | ‐72.6% | ‐724 | ‐72.5% | ‐ | ‐ | ‐ | ‐ | ‐ | ‐ | ‐ | ‐ | ‐ | ‐ | ‐ | ‐ |
| 4Q | 886 | 801 | 389 | ‐496 | ‐56.1% | ‐411 | ‐51.4% | ‐ | ‐ | ‐ | ‐ | ‐ | ‐ | ‐ | ‐ | ‐ | ‐ | ‐ | ‐ |
| Total | 3,780 | 3,633 | 1,461 | ‐2,319 | ‐61.4% | ‐2,172 | ‐59.8% | 1,754 | 1,061 | 931 | 961 | 886 | 1,025 | ‐1,005 to ‐831 | ‐53.1% to ‐43.9% | 89 to 263 | 11.2% to 33.0% | ‐867 to ‐693 | ‐49.5% to ‐39.5% |
| Compared to 2019 | Seat capacity (%) | Passenger number (thousand) | Passenger revenue (USD, million) | |||||||||
| Total | International | Domestic | Total | International | Domestic | Total | International | Domestic | ||||
| 1Q 2020 | ‐2.2% | ‐11.4% | ‐0.3% | ‐31,354 | ‐13.7% | ‐6,786 | ‐18.1% | ‐24,568 | ‐12.8% | ‐4,675 | ‐1,780 | ‐2,895 |
| 2Q 2020 | ‐71.4% | ‐91.4% | ‐67.5% | ‐228,637 | ‐87.4% | ‐39,617 | ‐96.7% | ‐189,020 | ‐85.6% | ‐32,893 | ‐10,618 | ‐22,274 |
| 3Q 2020 | ‐50.2% | ‐80.0% | ‐44.3% | ‐185,817 | ‐70.1% | ‐39,286 | ‐90.7% | ‐146,531 | ‐66.1% | ‐28,047 | ‐10,780 | ‐17,267 |
| 4Q 2020 | ‐44.2% | ‐67.0% | ‐40.1% | ‐153,541 | ‐62.8% | ‐30,354 | ‐82.4% | ‐123,187 | ‐59.4% | ‐22,799 | ‐8,283 | ‐14,517 |
| Total 2020 | ‐42.8% | ‐63.2% | ‐38.8% | ‐599,350 | ‐59.9% | ‐116,043 | ‐73.2% | ‐483,307 | ‐57.4% | ‐88,414 | ‐31,461 | ‐56,954 |
| 1Q 2021 | ‐47.5% to ‐46.2% | ‐64.3% to ‐63.1% | ‐44.1% to ‐42.8% | ‐151,913 to ‐144,296 | ‐66.3% to ‐63.0% | ‐29,564 to ‐28,713 | ‐78.9% to ‐76.7% | ‐122,350 to ‐115,583 | ‐63.8% to ‐60.3% | ‐22,222 to ‐21,215 | ‐7,804 to ‐7,594 | ‐14,418 to ‐13,620 |
| 2Q 2021 | ‐39.0% to ‐30.9% | ‐52.0% to ‐40.1% | ‐36.5% to ‐29.1% | ‐153,417 to ‐110,808 | ‐58.6% to ‐42.3% | ‐28,680 to ‐22,112 | ‐70.0% to ‐54.0% | ‐124,738 to ‐88,695 | ‐56.5% to ‐40.2% | ‐22,684 to ‐16,766 | ‐7,984 to ‐6,314 | ‐14,699 to ‐10,452 |
| 3Q 2021 | ‐ | ‐ | ‐ | ‐ | ‐ | ‐ | ‐ | ‐ | ‐ | ‐ | ‐ | ‐ |
| 4Q 2021 | ‐ | ‐ | ‐ | ‐ | ‐ | ‐ | ‐ | ‐ | ‐ | ‐ | ‐ | ‐ |
| Total 1Q/2Q 2021 | ‐43.1% to ‐38.3% | ‐58.0% to ‐51.3% | ‐40.1% to ‐35.7% | ‐305,331 to ‐255,103 | ‐62.2% to ‐52.0% | ‐58,243 to ‐50,825 | ‐74.3% to ‐64.8% | ‐247,088 to ‐204,278 | ‐59.9% to ‐49.5% | ‐44,906 to ‐37,980 | ‐15,788 to ‐13,908 | ‐29,117 to ‐24,072 |
Seat capacity
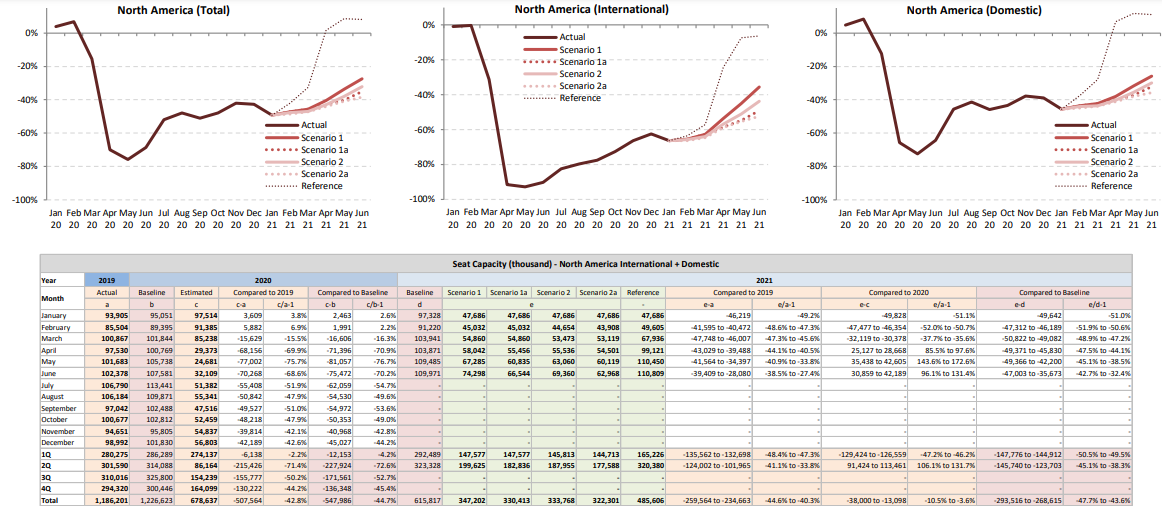
Seat capacity
| Seat Capacity (thousand) ‐ North America International | |||||||||||||||||||
| Year | 2019 | 2020 | 2021 | ||||||||||||||||
| Month | Actual | Baseline | Estimated | Compared to 2019 | Compared to Baseline | Baseline | Scenario 1 | Scenario 1a | Scenario 2 | Scenario 2a | Reference | Compared to 2019 | Compared to 2020 | Compared to Baseline | |||||
| a | b | c | c‐a | c/a‐1 | c‐b | c/b‐1 | d | e | ‐ | e‐a | e/a‐1 | e‐c | e/a‐1 | e‐d | e/d‐1 | ||||
| January | 16,096 | 15,506 | 15,947 | ‐149 | ‐0.9% | 442 | 2.8% | 15,429 | 5,410 | 5,410 | 5,410 | 5,410 | 5,410 | ‐10,687 | ‐66.4% | ‐10,538 | ‐66.1% | ‐10,019 | ‐64.9% |
| February | 14,365 | 14,391 | 14,338 | ‐27 | ‐0.2% | ‐53 | ‐0.4% | 14,325 | 5,300 | 5,300 | 5,214 | 5,127 | 5,363 | ‐9,238 to ‐9,065 | ‐64.3% to ‐63.1% | ‐9,211 to ‐9,038 | ‐64.2% to ‐63.0% | ‐9,198 to ‐9,025 | ‐64.2% to ‐63.0% |
| March | 16,706 | 16,170 | 11,500 | ‐5,205 | ‐31.2% | ‐4,670 | ‐28.9% | 16,108 | 6,708 | 6,708 | 6,423 | 6,294 | 7,794 | ‐10,412 to ‐9,997 | ‐62.3% to ‐59.8% | ‐5,207 to ‐4,792 | ‐45.3% to ‐41.7% | ‐9,815 to ‐9,400 | ‐60.9% to ‐58.4% |
| April | 16,153 | 16,300 | 1,365 | ‐14,788 | ‐91.6% | ‐14,935 | ‐91.6% | 16,584 | 8,095 | 7,203 | 7,510 | 7,131 | 13,283 | ‐9,022 to ‐8,058 | ‐55.9% to ‐49.9% | 5,766 to 6,730 | 422.5% to 493.1% | ‐9,453 to ‐8,489 | ‐57.0% to ‐51.2% |
| May | 16,441 | 16,711 | 1,202 | ‐15,238 | ‐92.7% | ‐15,509 | ‐92.8% | 17,046 | 9,768 | 8,015 | 8,744 | 7,906 | 15,300 | ‐8,535 to ‐6,673 | ‐51.9% to ‐40.6% | 6,704 to 8,565 | 557.5% to 712.4% | ‐9,140 to ‐7,278 | ‐53.6% to ‐42.7% |
| June | 17,118 | 17,390 | 1,690 | ‐15,428 | ‐90.1% | ‐15,700 | ‐90.3% | 17,639 | 11,916 | 9,417 | 10,441 | 8,815 | 16,077 | ‐8,303 to ‐5,202 | ‐48.5% to ‐30.4% | 7,125 to 10,226 | 421.6% to 605.2% | ‐8,825 to ‐5,724 | ‐50.0% to ‐32.4% |
| July | 18,138 | 18,510 | 3,177 | ‐14,960 | ‐82.5% | ‐15,332 | ‐82.8% | ‐ | ‐ | ‐ | ‐ | ‐ | ‐ | ‐ | ‐ | ‐ | ‐ | ‐ | ‐ |
| August | 17,797 | 18,096 | 3,608 | ‐14,188 | ‐79.7% | ‐14,488 | ‐80.1% | ‐ | ‐ | ‐ | ‐ | ‐ | ‐ | ‐ | ‐ | ‐ | ‐ | ‐ | ‐ |
| September | 15,583 | 15,971 | 3,497 | ‐12,086 | ‐77.6% | ‐12,474 | ‐78.1% | ‐ | ‐ | ‐ | ‐ | ‐ | ‐ | ‐ | ‐ | ‐ | ‐ | ‐ | ‐ |
| October | 15,357 | 14,961 | 4,224 | ‐11,132 | ‐72.5% | ‐10,737 | ‐71.8% | ‐ | ‐ | ‐ | ‐ | ‐ | ‐ | ‐ | ‐ | ‐ | ‐ | ‐ | ‐ |
| November | 14,303 | 13,859 | 4,804 | ‐9,498 | ‐66.4% | ‐9,055 | ‐65.3% | ‐ | ‐ | ‐ | ‐ | ‐ | ‐ | ‐ | ‐ | ‐ | ‐ | ‐ | ‐ |
| December | 15,987 | 15,543 | 6,015 | ‐9,972 | ‐62.4% | ‐9,528 | ‐61.3% | ‐ | ‐ | ‐ | ‐ | ‐ | ‐ | ‐ | ‐ | ‐ | ‐ | ‐ | ‐ |
| 1Q | 47,167 | 46,066 | 41,785 | ‐5,382 | ‐11.4% | ‐4,281 | ‐9.3% | 45,862 | 17,418 | 17,418 | 17,046 | 16,830 | 18,567 | ‐30,337 to ‐29,749 | ‐64.3% to ‐63.1% | ‐24,955 to ‐24,368 | ‐59.7% to ‐58.3% | ‐29,032 to ‐28,445 | ‐63.3% to ‐62.0% |
| 2Q | 49,711 | 50,401 | 4,257 | ‐45,454 | ‐91.4% | ‐46,144 | ‐91.6% | 51,269 | 29,779 | 24,636 | 26,695 | 23,852 | 44,660 | ‐25,860 to ‐19,933 | ‐52.0% to ‐40.1% | 19,595 to 25,522 | 460.3% to 599.5% | ‐27,417 to ‐21,490 | ‐53.5% to ‐41.9% |
| 3Q | 51,518 | 52,577 | 10,283 | ‐41,235 | ‐80.0% | ‐42,294 | ‐80.4% | ‐ | ‐ | ‐ | ‐ | ‐ | ‐ | ‐ | ‐ | ‐ | ‐ | ‐ | ‐ |
| 4Q | 45,646 | 44,364 | 15,043 | ‐30,603 | ‐67.0% | ‐29,320 | ‐66.1% | ‐ | ‐ | ‐ | ‐ | ‐ | ‐ | ‐ | ‐ | ‐ | ‐ | ‐ | ‐ |
| Total | 194,042 | 193,408 | 71,368 | ‐122,674 | ‐63.2% | ‐122,040 | ‐63.1% | 97,131 | 47,196 | 42,054 | 43,741 | 40,682 | 63,227 | ‐56,196 to ‐49,682 | ‐58.0% to ‐51.3% | ‐5,360 to 1,154 | ‐11.6% to 2.5% | ‐56,449 to ‐49,935 | ‐58.1% to ‐51.4% |
| Seat Capacity (thousand) ‐ North America Domestic | |||||||||||||||||||
| Year | 2019 | 2020 | 2021 | ||||||||||||||||
| Month | Actual | Baseline | Estimated | Compared to 2019 | Compared to Baseline | Baseline | Scenario 1 | Scenario 1a | Scenario 2 | Scenario 2a | Reference | Compared to 2019 | Compared to 2020 | Compared to Baseline | |||||
| a | b | c | c‐a | c/a‐1 | c‐b | c/b‐1 | d | e | ‐ | e‐a | e/a‐1 | e‐c | e/a‐1 | e‐d | e/d‐1 | ||||
| January | 77,808 | 79,545 | 81,567 | 3,758 | 4.8% | 2,021 | 2.5% | 81,899 | 42,276 | 42,276 | 42,276 | 42,276 | 42,276 | ‐35,532 | ‐45.7% | ‐39,290 | ‐48.2% | ‐39,623 | ‐48.4% |
| February | 71,139 | 75,004 | 77,048 | 5,909 | 8.3% | 2,044 | 2.7% | 76,895 | 41,127 | 41,127 | 40,577 | 39,899 | 44,457 | ‐31,239 to ‐30,012 | ‐43.9% to ‐42.2% | ‐37,149 to ‐35,921 | ‐48.2% to ‐46.6% | ‐36,996 to ‐35,768 | ‐48.1% to ‐46.5% |
| March | 84,161 | 85,673 | 73,737 | ‐10,424 | ‐12.4% | ‐11,936 | ‐13.9% | 87,833 | 49,938 | 49,938 | 48,507 | 48,201 | 61,804 | ‐35,960 to ‐34,223 | ‐42.7% to ‐40.7% | ‐25,536 to ‐23,799 | ‐34.6% to ‐32.3% | ‐39,632 to ‐37,895 | ‐45.1% to ‐43.1% |
| April | 81,377 | 84,469 | 28,009 | ‐53,368 | ‐65.6% | ‐56,460 | ‐66.8% | 87,287 | 52,271 | 50,157 | 49,903 | 49,039 | 89,374 | ‐32,338 to ‐29,106 | ‐39.7% to ‐35.8% | 21,031 to 24,262 | 75.1% to 86.6% | ‐38,248 to ‐35,017 | ‐43.8% to ‐40.1% |
| May | 85,242 | 89,027 | 23,478 | ‐61,763 | ‐72.5% | ‐65,548 | ‐73.6% | 92,439 | 60,478 | 55,216 | 56,924 | 54,326 | 95,166 | ‐30,915 to ‐24,763 | ‐36.3% to ‐29.1% | 30,848 to 37,000 | 131.4% to 157.6% | ‐38,113 to ‐31,961 | ‐41.2% to ‐34.6% |
| June | 85,260 | 90,191 | 30,420 | ‐54,840 | ‐64.3% | ‐59,772 | ‐66.3% | 92,332 | 65,944 | 60,012 | 61,840 | 56,652 | 94,680 | ‐28,608 to ‐19,316 | ‐33.6% to ‐22.7% | 26,232 to 35,524 | 86.2% to 116.8% | ‐35,680 to ‐26,388 | ‐38.6% to ‐28.6% |
| July | 88,652 | 94,932 | 48,204 | ‐40,448 | ‐45.6% | ‐46,727 | ‐49.2% | ‐ | ‐ | ‐ | ‐ | ‐ | ‐ | ‐ | ‐ | ‐ | ‐ | ‐ | ‐ |
| August | 88,387 | 91,775 | 51,733 | ‐36,654 | ‐41.5% | ‐40,042 | ‐43.6% | ‐ | ‐ | ‐ | ‐ | ‐ | ‐ | ‐ | ‐ | ‐ | ‐ | ‐ | ‐ |
| September | 81,459 | 86,517 | 44,018 | ‐37,440 | ‐46.0% | ‐42,498 | ‐49.1% | ‐ | ‐ | ‐ | ‐ | ‐ | ‐ | ‐ | ‐ | ‐ | ‐ | ‐ | ‐ |
| October | 85,321 | 87,850 | 48,235 | ‐37,086 | ‐43.5% | ‐39,616 | ‐45.1% | ‐ | ‐ | ‐ | ‐ | ‐ | ‐ | ‐ | ‐ | ‐ | ‐ | ‐ | ‐ |
| November | 80,348 | 81,945 | 50,032 | ‐30,316 | ‐37.7% | ‐31,913 | ‐38.9% | ‐ | ‐ | ‐ | ‐ | ‐ | ‐ | ‐ | ‐ | ‐ | ‐ | ‐ | ‐ |
| December | 83,006 | 86,287 | 50,789 | ‐32,217 | ‐38.8% | ‐35,498 | ‐41.1% | ‐ | ‐ | ‐ | ‐ | ‐ | ‐ | ‐ | ‐ | ‐ | ‐ | ‐ | ‐ |
| 1Q | 233,108 | 240,223 | 232,351 | ‐757 | ‐0.3% | ‐7,871 | ‐3.3% | 246,627 | 133,341 | 133,341 | 131,360 | 130,376 | 148,538 | ‐102,732 to ‐99,767 | ‐44.1% to ‐42.8% | ‐101,975 to ‐99,010 | ‐43.9% to ‐42.6% | ‐116,250 to ‐113,286 | ‐47.1% to ‐45.9% |
| 2Q | 251,878 | 263,687 | 81,907 | ‐169,972 | ‐67.5% | ‐181,780 | ‐68.9% | 272,059 | 178,693 | 165,385 | 168,667 | 160,017 | 279,220 | ‐91,861 to ‐73,185 | ‐36.5% to ‐29.1% | 78,110 to 96,787 | 95.4% to 118.2% | ‐112,042 to ‐93,366 | ‐41.2% to ‐34.3% |
| 3Q | 258,498 | 273,223 | 143,956 | ‐114,542 | ‐44.3% | ‐129,267 | ‐47.3% | ‐ | ‐ | ‐ | ‐ | ‐ | ‐ | ‐ | ‐ | ‐ | ‐ | ‐ | ‐ |
| 4Q | 248,675 | 256,083 | 149,055 | ‐99,619 | ‐40.1% | ‐107,027 | ‐41.8% | ‐ | ‐ | ‐ | ‐ | ‐ | ‐ | ‐ | ‐ | ‐ | ‐ | ‐ | ‐ |
| Total | 992,159 | 1,033,215 | 607,269 | ‐384,890 | ‐38.8% | ‐425,946 | ‐41.2% | 518,686 | 312,034 | 298,726 | 300,028 | 290,394 | 427,758 | ‐194,593 to ‐172,952 | ‐40.1% to ‐35.7% | ‐23,864 to ‐2,224 | ‐7.6% to ‐0.7% | ‐228,292 to ‐206,651 | ‐44.0% to ‐39.8% |
Passenger number
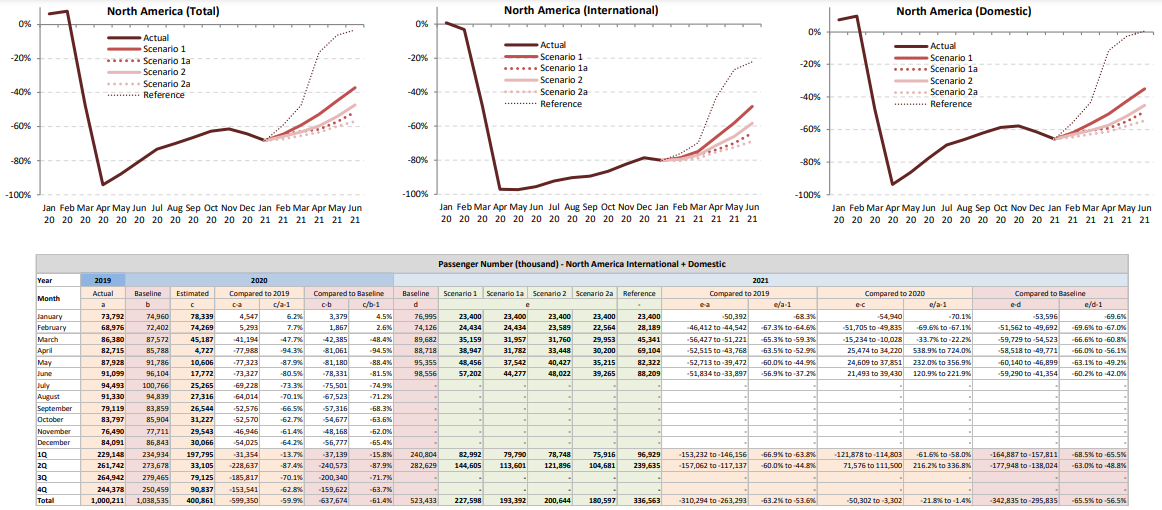
Passenger number
| Passenger Number (thousand) ‐ North America International | |||||||||||||||||||
| Year | 2019 | 2020 | 2021 | ||||||||||||||||
| Month | Actual | Baseline | Estimated | Compared to 2019 | Compared to Baseline | Baseline | Scenario 1 | Scenario 1a | Scenario 2 | Scenario 2a | Reference | Compared to 2019 | Compared to 2020 | Compared to Baseline | |||||
| a | b | c | c‐a | c/a‐1 | c‐b | c/b‐1 | d | e | ‐ | e‐a | e/a‐1 | e‐c | e/a‐1 | e‐d | e/d‐1 | ||||
| January | 12,728 | 12,303 | 12,827 | 99 | 0.8% | 524 | 4.3% | 12,265 | 2,516 | 2,516 | 2,516 | 2,516 | 2,516 | ‐10,212 | ‐80.2% | ‐10,311 | ‐80.4% | ‐9,748 | ‐79.5% |
| February | 11,162 | 11,222 | 10,790 | ‐372 | ‐3.3% | ‐432 | ‐3.8% | 11,189 | 2,561 | 2,561 | 2,437 | 2,315 | 2,718 | ‐8,847 to ‐8,601 | ‐79.3% to ‐77.1% | ‐8,475 to ‐8,229 | ‐78.5% to ‐76.3% | ‐8,874 to ‐8,628 | ‐79.3% to ‐77.1% |
| March | 13,565 | 13,174 | 7,052 | ‐6,513 | ‐48.0% | ‐6,122 | ‐46.5% | 13,150 | 3,665 | 3,408 | 3,336 | 3,059 | 4,445 | ‐10,505 to ‐9,900 | ‐77.4% to ‐73.0% | ‐3,992 to ‐3,387 | ‐56.6% to ‐48.0% | ‐10,091 to ‐9,486 | ‐76.7% to ‐72.1% |
| April | 13,169 | 13,333 | 379 | ‐12,790 | ‐97.1% | ‐12,954 | ‐97.2% | 13,591 | 4,760 | 3,683 | 4,076 | 3,490 | 8,128 | ‐9,679 to ‐8,409 | ‐73.5% to ‐63.9% | 3,111 to 4,381 | 820.6% to 1155.8% | ‐10,101 to ‐8,831 | ‐74.3% to ‐65.0% |
| May | 13,346 | 13,605 | 350 | ‐12,996 | ‐97.4% | ‐13,254 | ‐97.4% | 13,901 | 6,030 | 4,306 | 4,925 | 3,967 | 9,802 | ‐9,380 to ‐7,317 | ‐70.3% to ‐54.8% | 3,617 to 5,679 | 1032.2% to 1621.0% | ‐9,934 to ‐7,871 | ‐71.5% to ‐56.6% |
| June | 14,467 | 14,741 | 636 | ‐13,831 | ‐95.6% | ‐14,104 | ‐95.7% | 14,978 | 8,080 | 5,621 | 6,539 | 4,847 | 11,281 | ‐9,621 to ‐6,387 | ‐66.5% to ‐44.1% | 4,210 to 7,444 | 661.6% to 1169.8% | ‐10,132 to ‐6,898 | ‐67.6% to ‐46.1% |
| July | 15,475 | 15,840 | 1,216 | ‐14,259 | ‐92.1% | ‐14,623 | ‐92.3% | ‐ | ‐ | ‐ | ‐ | ‐ | ‐ | ‐ | ‐ | ‐ | ‐ | ‐ | ‐ |
| August | 15,240 | 15,542 | 1,491 | ‐13,749 | ‐90.2% | ‐14,051 | ‐90.4% | ‐ | ‐ | ‐ | ‐ | ‐ | ‐ | ‐ | ‐ | ‐ | ‐ | ‐ | ‐ |
| September | 12,609 | 12,959 | 1,332 | ‐11,278 | ‐89.4% | ‐11,628 | ‐89.7% | ‐ | ‐ | ‐ | ‐ | ‐ | ‐ | ‐ | ‐ | ‐ | ‐ | ‐ | ‐ |
| October | 12,323 | 12,040 | 1,657 | ‐10,666 | ‐86.6% | ‐10,383 | ‐86.2% | ‐ | ‐ | ‐ | ‐ | ‐ | ‐ | ‐ | ‐ | ‐ | ‐ | ‐ | ‐ |
| November | 11,370 | 11,052 | 2,020 | ‐9,350 | ‐82.2% | ‐9,031 | ‐81.7% | ‐ | ‐ | ‐ | ‐ | ‐ | ‐ | ‐ | ‐ | ‐ | ‐ | ‐ | ‐ |
| December | 13,142 | 12,817 | 2,803 | ‐10,338 | ‐78.7% | ‐10,014 | ‐78.1% | ‐ | ‐ | ‐ | ‐ | ‐ | ‐ | ‐ | ‐ | ‐ | ‐ | ‐ | ‐ |
| 1Q | 37,454 | 36,699 | 30,669 | ‐6,786 | ‐18.1% | ‐6,030 | ‐16.4% | 36,604 | 8,742 | 8,485 | 8,289 | 7,891 | 9,679 | ‐29,564 to ‐28,713 | ‐78.9% to ‐76.7% | ‐22,778 to ‐21,927 | ‐74.3% to ‐71.5% | ‐28,714 to ‐27,862 | ‐78.4% to ‐76.1% |
| 2Q | 40,983 | 41,679 | 1,366 | ‐39,617 | ‐96.7% | ‐40,313 | ‐96.7% | 42,470 | 18,871 | 13,610 | 15,540 | 12,303 | 29,211 | ‐28,680 to ‐22,112 | ‐70.0% to ‐54.0% | 10,938 to 17,505 | 800.8% to 1281.7% | ‐30,167 to ‐23,600 | ‐71.0% to ‐55.6% |
| 3Q | 43,325 | 44,341 | 4,039 | ‐39,286 | ‐90.7% | ‐40,302 | ‐90.9% | ‐ | ‐ | ‐ | ‐ | ‐ | ‐ | ‐ | ‐ | ‐ | ‐ | ‐ | ‐ |
| 4Q | 36,835 | 35,909 | 6,481 | ‐30,354 | ‐82.4% | ‐29,428 | ‐82.0% | ‐ | ‐ | ‐ | ‐ | ‐ | ‐ | ‐ | ‐ | ‐ | ‐ | ‐ | ‐ |
| Total | 158,597 | 158,627 | 42,554 | ‐116,043 | ‐73.2% | ‐116,073 | ‐73.2% | 79,075 | 27,612 | 22,094 | 23,829 | 20,194 | 38,890 | ‐58,243 to ‐50,825 | ‐74.3% to ‐64.8% | ‐11,840 to ‐4,422 | ‐37.0% to ‐13.8% | ‐58,881 to ‐51,462 | ‐74.5% to ‐65.1% |
| Passenger Number (thousand) ‐ North America Domestic | |||||||||||||||||||
| Year | 2019 | 2020 | 2021 | ||||||||||||||||
| Month | Actual | Baseline | Estimated | Compared to 2019 | Compared to Baseline | Baseline | Scenario 1 | Scenario 1a | Scenario 2 | Scenario 2a | Reference | Compared to 2019 | Compared to 2020 | Compared to Baseline | |||||
| a | b | c | c‐a | c/a‐1 | c‐b | c/b‐1 | d | e | ‐ | e‐a | e/a‐1 | e‐c | e/a‐1 | e‐d | e/d‐1 | ||||
| January | 61,064 | 62,657 | 65,512 | 4,448 | 7.3% | 2,855 | 4.6% | 64,731 | 20,883 | 20,883 | 20,883 | 20,883 | 20,883 | ‐40,180 | ‐65.8% | ‐44,629 | ‐68.1% | ‐43,847 | ‐67.7% |
| February | 57,815 | 61,181 | 63,480 | 5,665 | 9.8% | 2,299 | 3.8% | 62,937 | 22,618 | 22,618 | 21,741 | 20,812 | 25,585 | ‐37,002 to ‐35,196 | ‐64.0% to ‐60.9% | ‐42,667 to ‐40,861 | ‐67.2% to ‐64.4% | ‐42,124 to ‐40,318 | ‐66.9% to ‐64.1% |
| March | 72,816 | 74,398 | 38,135 | ‐34,681 | ‐47.6% | ‐36,263 | ‐48.7% | 76,532 | 32,609 | 29,567 | 29,268 | 27,649 | 41,958 | ‐45,167 to ‐40,206 | ‐62.0% to ‐55.2% | ‐10,486 to ‐5,525 | ‐27.5% to ‐14.5% | ‐48,883 to ‐43,923 | ‐63.9% to ‐57.4% |
| April | 69,546 | 72,455 | 4,348 | ‐65,198 | ‐93.7% | ‐68,107 | ‐94.0% | 75,127 | 35,719 | 29,170 | 30,483 | 27,616 | 63,381 | ‐41,930 to ‐33,827 | ‐60.3% to ‐48.6% | 23,268 to 31,371 | 535.2% to 721.6% | ‐47,511 to ‐39,408 | ‐63.2% to ‐52.5% |
| May | 74,582 | 78,181 | 10,255 | ‐64,327 | ‐86.2% | ‐67,926 | ‐86.9% | 81,454 | 44,521 | 34,688 | 37,143 | 32,458 | 72,527 | ‐42,125 to ‐30,062 | ‐56.5% to ‐40.3% | 22,202 to 34,265 | 216.5% to 334.1% | ‐48,997 to ‐36,934 | ‐60.2% to ‐45.3% |
| June | 76,632 | 81,363 | 17,136 | ‐59,496 | ‐77.6% | ‐64,227 | ‐78.9% | 83,578 | 51,825 | 40,551 | 43,475 | 35,948 | 76,883 | ‐40,683 to ‐24,807 | ‐53.1% to ‐32.4% | 18,812 to 34,689 | 109.8% to 202.4% | ‐47,629 to ‐31,752 | ‐57.0% to ‐38.0% |
| July | 79,018 | 84,927 | 24,049 | ‐54,969 | ‐69.6% | ‐60,878 | ‐71.7% | ‐ | ‐ | ‐ | ‐ | ‐ | ‐ | ‐ | ‐ | ‐ | ‐ | ‐ | ‐ |
| August | 76,089 | 79,297 | 25,825 | ‐50,265 | ‐66.1% | ‐53,472 | ‐67.4% | ‐ | ‐ | ‐ | ‐ | ‐ | ‐ | ‐ | ‐ | ‐ | ‐ | ‐ | ‐ |
| September | 66,510 | 70,900 | 25,212 | ‐41,298 | ‐62.1% | ‐45,688 | ‐64.4% | ‐ | ‐ | ‐ | ‐ | ‐ | ‐ | ‐ | ‐ | ‐ | ‐ | ‐ | ‐ |
| October | 71,474 | 73,864 | 29,570 | ‐41,904 | ‐58.6% | ‐44,294 | ‐60.0% | ‐ | ‐ | ‐ | ‐ | ‐ | ‐ | ‐ | ‐ | ‐ | ‐ | ‐ | ‐ |
| November | 65,120 | 66,659 | 27,523 | ‐37,597 | ‐57.7% | ‐39,136 | ‐58.7% | ‐ | ‐ | ‐ | ‐ | ‐ | ‐ | ‐ | ‐ | ‐ | ‐ | ‐ | ‐ |
| December | 70,949 | 74,026 | 27,263 | ‐43,687 | ‐61.6% | ‐46,763 | ‐63.2% | ‐ | ‐ | ‐ | ‐ | ‐ | ‐ | ‐ | ‐ | ‐ | ‐ | ‐ | ‐ |
| 1Q | 191,694 | 198,235 | 167,126 | ‐24,568 | ‐12.8% | ‐31,109 | ‐15.7% | 204,199 | 76,111 | 73,068 | 71,893 | 69,344 | 88,427 | ‐122,350 to ‐115,583 | ‐63.8% to ‐60.3% | ‐97,782 to ‐91,015 | ‐58.5% to ‐54.5% | ‐134,855 to ‐128,088 | ‐66.0% to ‐62.7% |
| 2Q | 220,760 | 231,999 | 31,739 | ‐189,020 | ‐85.6% | ‐200,260 | ‐86.3% | 240,158 | 132,064 | 104,410 | 111,100 | 96,022 | 212,790 | ‐124,738 to ‐88,695 | ‐56.5% to ‐40.2% | 64,283 to 100,325 | 202.5% to 316.1% | ‐144,137 to ‐108,094 | ‐60.0% to ‐45.0% |
| 3Q | 221,617 | 235,124 | 75,086 | ‐146,531 | ‐66.1% | ‐160,038 | ‐68.1% | ‐ | ‐ | ‐ | ‐ | ‐ | ‐ | ‐ | ‐ | ‐ | ‐ | ‐ | ‐ |
| 4Q | 207,543 | 214,550 | 84,356 | ‐123,187 | ‐59.4% | ‐130,194 | ‐60.7% | ‐ | ‐ | ‐ | ‐ | ‐ | ‐ | ‐ | ‐ | ‐ | ‐ | ‐ | ‐ |
| Total | 841,614 | 879,908 | 358,307 | ‐483,307 | ‐57.4% | ‐521,601 | ‐59.3% | 444,358 | 208,175 | 177,478 | 182,993 | 165,366 | 301,217 | ‐247,088 to ‐204,278 | ‐59.9% to ‐49.5% | ‐33,499 to 9,310 | ‐16.8% to 4.7% | ‐278,992 to ‐236,182 | ‐62.8% to ‐53.2% |
Passenger revenue
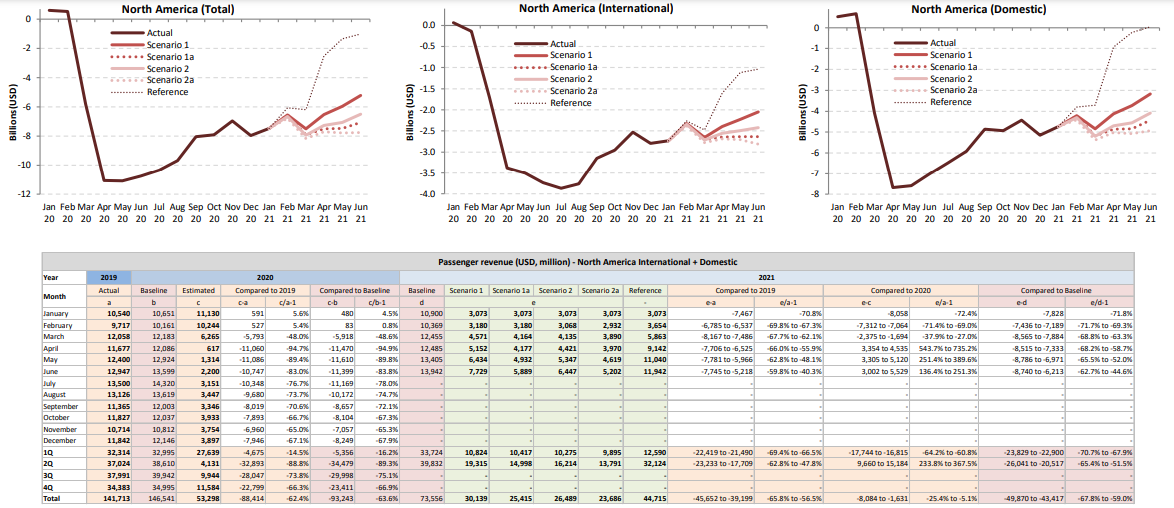
Passenger revenue
| Passenger revenue (USD, million) ‐ North America International | |||||||||||||||||||
| Year | 2019 | 2020 | 2021 | ||||||||||||||||
| Month | Actual | Baseline | Estimated | Compared to 2019 | Compared to Baseline | Baseline | Scenario 1 | Scenario 1a | Scenario 2 | Scenario 2a | Reference | Compared to 2019 | Compared to 2020 | Compared to Baseline | |||||
| a | b | c | c‐a | c/a‐1 | c‐b | c/b‐1 | d | e | ‐ | e‐a | e/a‐1 | e‐c | e/a‐1 | e‐d | e/d‐1 | ||||
| January | 3,344 | 3,267 | 3,410 | 66 | 2.0% | 143 | 4.4% | 3,272 | 612 | 612 | 612 | 612 | 612 | ‐2,732 | ‐81.7% | ‐2,799 | ‐82.1% | ‐2,660 | ‐81.3% |
| February | 2,904 | 2,951 | 2,763 | ‐141 | ‐4.8% | ‐188 | ‐6.4% | 2,952 | 624 | 624 | 593 | 563 | 662 | ‐2,341 to ‐2,280 | ‐80.6% to ‐78.5% | ‐2,200 to ‐2,140 | ‐79.6% to ‐77.4% | ‐2,389 to ‐2,328 | ‐80.9% to ‐78.9% |
| March | 3,477 | 3,416 | 1,771 | ‐1,706 | ‐49.1% | ‐1,645 | ‐48.2% | 3,437 | 895 | 833 | 814 | 746 | 1,091 | ‐2,731 to ‐2,582 | ‐78.5% to ‐74.2% | ‐1,025 to ‐876 | ‐57.9% to ‐49.4% | ‐2,691 to ‐2,541 | ‐78.3% to ‐73.9% |
| April | 3,481 | 3,548 | 104 | ‐3,377 | ‐97.0% | ‐3,444 | ‐97.1% | 3,632 | 1,171 | 901 | 1,000 | 854 | 2,052 | ‐2,627 to ‐2,310 | ‐75.5% to ‐66.4% | 750 to 1,066 | 717.4% to 1020.6% | ‐2,778 to ‐2,461 | ‐76.5% to ‐67.8% |
| May | 3,611 | 3,711 | 106 | ‐3,505 | ‐97.1% | ‐3,606 | ‐97.1% | 3,807 | 1,497 | 1,058 | 1,216 | 975 | 2,494 | ‐2,636 to ‐2,114 | ‐73.0% to ‐58.5% | 869 to 1,392 | 821.2% to 1315.0% | ‐2,832 to ‐2,309 | ‐74.4% to ‐60.7% |
| June | 3,917 | 4,011 | 181 | ‐3,736 | ‐95.4% | ‐3,830 | ‐95.5% | 4,093 | 2,027 | 1,391 | 1,629 | 1,196 | 2,874 | ‐2,721 to ‐1,890 | ‐69.5% to ‐48.2% | 1,015 to 1,847 | 561.9% to 1022.2% | ‐2,897 to ‐2,066 | ‐70.8% to ‐50.5% |
| July | 4,188 | 4,312 | 317 | ‐3,871 | ‐92.4% | ‐3,995 | ‐92.6% | ‐ | ‐ | ‐ | ‐ | ‐ | ‐ | ‐ | ‐ | ‐ | ‐ | ‐ | ‐ |
| August | 4,160 | 4,274 | 403 | ‐3,757 | ‐90.3% | ‐3,871 | ‐90.6% | ‐ | ‐ | ‐ | ‐ | ‐ | ‐ | ‐ | ‐ | ‐ | ‐ | ‐ | ‐ |
| September | 3,528 | 3,648 | 375 | ‐3,153 | ‐89.4% | ‐3,273 | ‐89.7% | ‐ | ‐ | ‐ | ‐ | ‐ | ‐ | ‐ | ‐ | ‐ | ‐ | ‐ | ‐ |
| October | 3,404 | 3,333 | 449 | ‐2,955 | ‐86.8% | ‐2,884 | ‐86.5% | ‐ | ‐ | ‐ | ‐ | ‐ | ‐ | ‐ | ‐ | ‐ | ‐ | ‐ | ‐ |
| November | 3,040 | 2,956 | 511 | ‐2,529 | ‐83.2% | ‐2,445 | ‐82.7% | ‐ | ‐ | ‐ | ‐ | ‐ | ‐ | ‐ | ‐ | ‐ | ‐ | ‐ | ‐ |
| December | 3,482 | 3,422 | 684 | ‐2,798 | ‐80.4% | ‐2,738 | ‐80.0% | ‐ | ‐ | ‐ | ‐ | ‐ | ‐ | ‐ | ‐ | ‐ | ‐ | ‐ | ‐ |
| 1Q | 9,725 | 9,634 | 7,945 | ‐1,780 | ‐18.3% | ‐1,690 | ‐17.5% | 9,661 | 2,131 | 2,068 | 2,019 | 1,921 | 2,365 | ‐7,804 to ‐7,594 | ‐80.2% to ‐78.1% | ‐6,024 to ‐5,814 | ‐75.8% to ‐73.2% | ‐7,740 to ‐7,530 | ‐80.1% to ‐77.9% |
| 2Q | 11,009 | 11,271 | 391 | ‐10,618 | ‐96.4% | ‐10,880 | ‐96.5% | 11,532 | 4,695 | 3,351 | 3,844 | 3,025 | 7,420 | ‐7,984 to ‐6,314 | ‐72.5% to ‐57.3% | 2,634 to 4,304 | 673.7% to 1101.0% | ‐8,507 to ‐6,836 | ‐73.8% to ‐59.3% |
| 3Q | 11,876 | 12,235 | 1,096 | ‐10,780 | ‐90.8% | ‐11,139 | ‐91.0% | ‐ | ‐ | ‐ | ‐ | ‐ | ‐ | ‐ | ‐ | ‐ | ‐ | ‐ | ‐ |
| 4Q | 9,926 | 9,712 | 1,643 | ‐8,283 | ‐83.4% | ‐8,068 | ‐83.1% | ‐ | ‐ | ‐ | ‐ | ‐ | ‐ | ‐ | ‐ | ‐ | ‐ | ‐ | ‐ |
| Total | 42,536 | 42,851 | 11,075 | ‐31,461 | ‐74.0% | ‐31,777 | ‐74.2% | 21,193 | 6,826 | 5,419 | 5,863 | 4,945 | 9,785 | ‐15,788 to ‐13,908 | ‐76.1% to ‐67.1% | ‐3,390 to ‐1,510 | ‐40.7% to ‐18.1% | ‐16,247 to ‐14,367 | ‐76.7% to ‐67.8% |
| Passenger revenue (USD, million) ‐ North America Domestic | |||||||||||||||||||
| Year | 2019 | 2020 | 2021 | ||||||||||||||||
| Month | Actual | Baseline | Estimated | Compared to 2019 | Compared to Baseline | Baseline | Scenario 1 | Scenario 1a | Scenario 2 | Scenario 2a | Reference | Compared to 2019 | Compared to 2020 | Compared to Baseline | |||||
| a | b | c | c‐a | c/a‐1 | c‐b | c/b‐1 | d | e | ‐ | e‐a | e/a‐1 | e‐c | e/a‐1 | e‐d | e/d‐1 | ||||
| January | 7,196 | 7,384 | 7,720 | 524 | 7.3% | 336 | 4.6% | 7,628 | 2,461 | 2,461 | 2,461 | 2,461 | 2,461 | ‐4,735 | ‐65.8% | ‐5,259 | ‐68.1% | ‐5,167 | ‐67.7% |
| February | 6,813 | 7,210 | 7,481 | 668 | 9.8% | 271 | 3.8% | 7,417 | 2,665 | 2,665 | 2,562 | 2,453 | 3,015 | ‐4,360 to ‐4,148 | ‐64.0% to ‐60.9% | ‐5,028 to ‐4,815 | ‐67.2% to ‐64.4% | ‐4,964 to ‐4,751 | ‐66.9% to ‐64.1% |
| March | 8,581 | 8,767 | 4,494 | ‐4,087 | ‐47.6% | ‐4,273 | ‐48.7% | 9,019 | 3,843 | 3,484 | 3,449 | 3,258 | 4,944 | ‐5,323 to ‐4,738 | ‐62.0% to ‐55.2% | ‐1,236 to ‐651 | ‐27.5% to ‐14.5% | ‐5,760 to ‐5,176 | ‐63.9% to ‐57.4% |
| April | 8,195 | 8,538 | 512 | ‐7,683 | ‐93.7% | ‐8,026 | ‐94.0% | 8,853 | 4,209 | 3,437 | 3,592 | 3,254 | 7,469 | ‐4,941 to ‐3,986 | ‐60.3% to ‐48.6% | 2,742 to 3,697 | 535.2% to 721.6% | ‐5,599 to ‐4,644 | ‐63.2% to ‐52.5% |
| May | 8,789 | 9,213 | 1,209 | ‐7,580 | ‐86.2% | ‐8,004 | ‐86.9% | 9,599 | 5,246 | 4,088 | 4,377 | 3,825 | 8,547 | ‐4,964 to ‐3,542 | ‐56.5% to ‐40.3% | 2,616 to 4,038 | 216.5% to 334.1% | ‐5,774 to ‐4,352 | ‐60.2% to ‐45.3% |
| June | 9,030 | 9,588 | 2,019 | ‐7,011 | ‐77.6% | ‐7,569 | ‐78.9% | 9,849 | 6,107 | 4,779 | 5,123 | 4,236 | 9,060 | ‐4,794 to ‐2,923 | ‐53.1% to ‐32.4% | 2,217 to 4,088 | 109.8% to 202.4% | ‐5,613 to ‐3,742 | ‐57.0% to ‐38.0% |
| July | 9,312 | 10,008 | 2,834 | ‐6,478 | ‐69.6% | ‐7,174 | ‐71.7% | ‐ | ‐ | ‐ | ‐ | ‐ | ‐ | ‐ | ‐ | ‐ | ‐ | ‐ | ‐ |
| August | 8,966 | 9,344 | 3,043 | ‐5,923 | ‐66.1% | ‐6,301 | ‐67.4% | ‐ | ‐ | ‐ | ‐ | ‐ | ‐ | ‐ | ‐ | ‐ | ‐ | ‐ | ‐ |
| September | 7,838 | 8,355 | 2,971 | ‐4,867 | ‐62.1% | ‐5,384 | ‐64.4% | ‐ | ‐ | ‐ | ‐ | ‐ | ‐ | ‐ | ‐ | ‐ | ‐ | ‐ | ‐ |
| October | 8,423 | 8,704 | 3,485 | ‐4,938 | ‐58.6% | ‐5,220 | ‐60.0% | ‐ | ‐ | ‐ | ‐ | ‐ | ‐ | ‐ | ‐ | ‐ | ‐ | ‐ | ‐ |
| November | 7,674 | 7,855 | 3,243 | ‐4,430 | ‐57.7% | ‐4,612 | ‐58.7% | ‐ | ‐ | ‐ | ‐ | ‐ | ‐ | ‐ | ‐ | ‐ | ‐ | ‐ | ‐ |
| December | 8,361 | 8,723 | 3,213 | ‐5,148 | ‐61.6% | ‐5,511 | ‐63.2% | ‐ | ‐ | ‐ | ‐ | ‐ | ‐ | ‐ | ‐ | ‐ | ‐ | ‐ | ‐ |
| 1Q | 22,590 | 23,360 | 19,694 | ‐2,895 | ‐12.8% | ‐3,666 | ‐15.7% | 24,063 | 8,969 | 8,610 | 8,472 | 8,172 | 10,420 | ‐14,418 to ‐13,620 | ‐63.8% to ‐60.3% | ‐11,523 to ‐10,725 | ‐58.5% to ‐54.5% | ‐15,892 to ‐15,094 | ‐66.0% to ‐62.7% |
| 2Q | 26,015 | 27,339 | 3,740 | ‐22,274 | ‐85.6% | ‐23,599 | ‐86.3% | 28,301 | 15,563 | 12,304 | 13,092 | 11,315 | 25,076 | ‐14,699 to ‐10,452 | ‐56.5% to ‐40.2% | 7,575 to 11,822 | 202.5% to 316.1% | ‐16,985 to ‐12,738 | ‐60.0% to ‐45.0% |
| 3Q | 26,116 | 27,707 | 8,848 | ‐17,267 | ‐66.1% | ‐18,859 | ‐68.1% | ‐ | ‐ | ‐ | ‐ | ‐ | ‐ | ‐ | ‐ | ‐ | ‐ | ‐ | ‐ |
| 4Q | 24,457 | 25,283 | 9,941 | ‐14,517 | ‐59.4% | ‐15,342 | ‐60.7% | ‐ | ‐ | ‐ | ‐ | ‐ | ‐ | ‐ | ‐ | ‐ | ‐ | ‐ | ‐ |
| Total | 99,177 | 103,690 | 42,223 | ‐56,954 | ‐57.4% | ‐61,466 | ‐59.3% | 52,364 | 24,532 | 20,914 | 21,564 | 19,487 | 35,496 | ‐29,117 to ‐24,072 | ‐59.9% to ‐49.5% | ‐3,948 to 1,097 | ‐16.8% to 4.7% | ‐32,877 to ‐27,832 | ‐62.8% to ‐53.2% |
Appendix A: Overview of Early Impact
COVID‐19 outbreak has impacted air traffic of China starting from late January 2020
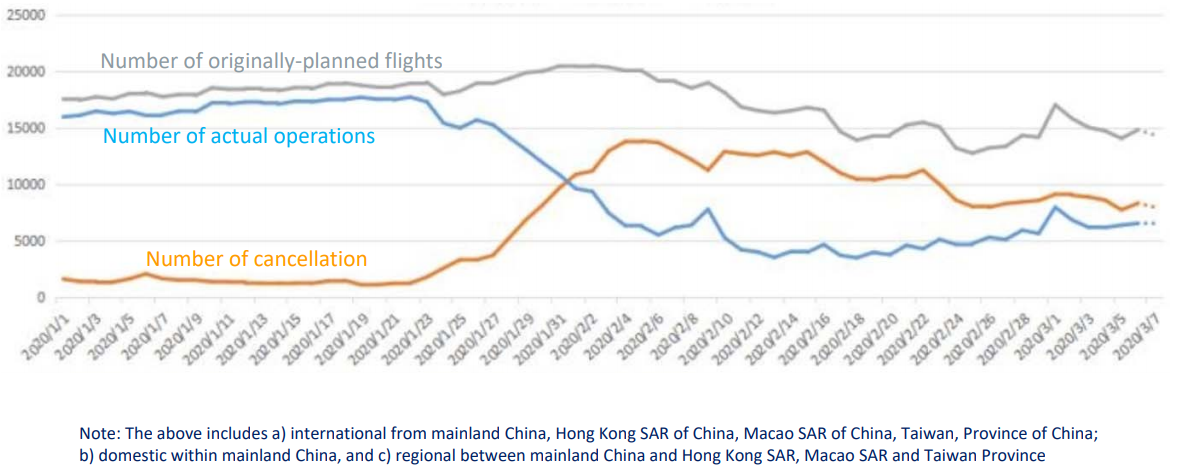
A surge of COVID‐19 confirmed cases occurred in several States by late February 2020
In February 2020, international passenger capacity reduced by 10%, mainly related to traffic from/to States experiencing an early outbreak and States deeply interconnected to China.
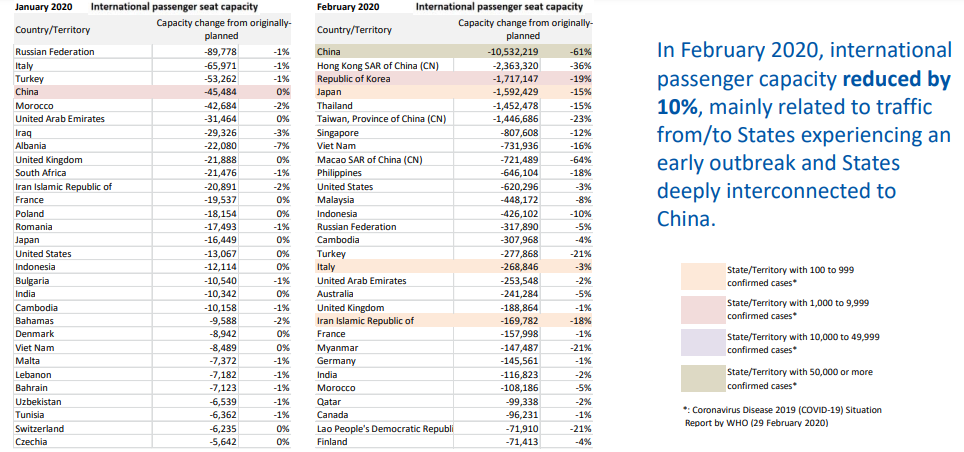
COVID‐19 Pandemic was declared and accelerating in March 2020
In March 2020, global international passenger capacity reduced by 48%, with significant reduction not only in States experiencing an early outbreak but also worldwide.
March 2020 International Passenger Capacity
| Country/Territory | Capacity change from | |||
| originally‐planned | ||||
| China | ‐14,841,792 | ‐82% | ||
| Italy | ‐6,860,837 | ‐60% | ||
| Republic of Korea | ‐6,536,917 | ‐70% | ||
| Japan | ‐5,837,894 | ‐51% | ||
| Germany | ‐5,771,162 | ‐31% | ||
| Hong Kong SAR of China (CN) | ‐5,352,855 | ‐77% | ||
| United Kingdom | ‐4,965,296 | ‐22% | ||
| United States | ‐4,950,969 | ‐19% | ||
| Thailand | ‐4,587,421 | ‐46% | ||
| Taiwan, Province of China (CN) | ‐4,074,431 | ‐62% | ||
| Spain | ‐3,792,140 | ‐26% | ||
| United Arab Emirates | ‐3,400,833 | ‐26% | ||
| Singapore | ‐3,297,434 | ‐45% | ||
| France | ‐3,216,482 | ‐25% | ||
| Turkey | ‐2,879,271 | ‐35% | ||
| Viet Nam | ‐2,599,336 | ‐55% | ||
| Malaysia | ‐2,500,355 | ‐42% | ||
| India | ‐2,077,578 | ‐29% | ||
| Saudi Arabia | ‐1,747,385 | ‐31% | ||
| Switzerland | ‐1,691,017 | ‐28% | ||
| Country/Territory | Capacity change from originally‐planned | |
| Philippines | ‐1,669,456 | ‐45% |
| Indonesia | ‐1,466,518 | ‐34% |
| Netherlands | ‐1,292,472 | ‐17% |
| Canada | ‐1,218,383 | ‐16% |
| Austria | ‐1,200,864 | ‐30% |
| Russian Federation | ‐1,177,704 | ‐19% |
| Australia | ‐1,119,345 | ‐25% |
| Portugal | ‐1,118,941 | ‐26% |
| Belgium | ‐1,060,572 | ‐31% |
| Qatar | ‐1,041,439 | ‐21% |
| Denmark | ‐980,211 | ‐28% |
| Israel | ‐972,061 | ‐44% |
| Poland | ‐967,520 | ‐24% |
| Macao SAR of China (CN) | ‐954,453 | ‐80% |
| Egypt | ‐818,043 | ‐28% |
| Morocco | ‐762,145 | ‐31% |
| Sweden | ‐761,425 | ‐24% |
| Ireland | ‐733,678 | ‐21% |
| Greece | ‐635,039 | ‐34% |
| Czechia | ‐610,048 | ‐37% |
The world reached 3 million confirmed COVID‐19 cases in April 2020
In April 2020, global international passenger capacity so far experienced by unprecedented 94% reduction (estimated)
April 2020 International Passenger Capacity
| Country/Territory | Capacity change from | ||
| originally‐planned | |||
| United States | ‐22,976,621 | ‐88% | |
| United Kingdom | ‐22,345,210 | ‐90% | |
| Germany | ‐19,374,444 | ‐92% | |
| Spain | ‐18,041,897 | ‐94% | |
| China | ‐16,683,876 | ‐95% | |
| France | ‐13,480,021 | ‐91% | |
| Italy | ‐12,464,502 | ‐94% | |
| United Arab Emirates | ‐11,009,896 | ‐89% | |
| Japan | ‐9,501,833 | ‐88% | |
| Turkey | ‐8,798,224 | ‐94% | |
| Thailand | ‐8,441,105 | ‐94% | |
| Republic of Korea | ‐7,960,525 | ‐86% | |
| Hong Kong SAR of China (CN) | ‐7,122,206 | ‐93% | |
| Netherlands | ‐6,960,693 | ‐89% | |
| Singapore | ‐6,596,279 | ‐93% | |
| Canada | ‐6,288,656 | ‐90% | |
| India | ‐6,286,458 | ‐89% | |
| Switzerland | ‐5,990,424 | ‐93% | |
| Russian Federation | ‐5,747,918 | ‐87% | |
| Taiwan, Province of China (CN) | ‐5,400,277 | ‐85% | |
| Country/Territory | Capacity change from | |
| originally‐planned | ||
| Malaysia | ‐4,959,606 | ‐85% |
| Portugal | ‐4,913,803 | ‐95% |
| Saudi Arabia | ‐4,193,572 | ‐77% |
| Australia | ‐4,115,805 | ‐92% |
| Mexico | ‐4,104,882 | ‐78% |
| Austria | ‐3,812,866 | ‐91% |
| Qatar | ‐3,760,492 | ‐80% |
| Indonesia | ‐3,723,583 | ‐87% |
| Vietnam | ‐3,681,731 | ‐89% |
| Ireland | ‐3,595,318 | ‐92% |
| Poland | ‐3,449,632 | ‐79% |
| Denmark | ‐3,417,729 | ‐93% |
| Belgium | ‐3,323,135 | ‐87% |
| Greece | ‐3,078,774 | ‐94% |
| Philippines | ‐2,993,741 | ‐86% |
| Sweden | ‐2,941,579 | ‐89% |
| Norway | ‐2,476,519 | ‐90% |
| Egypt | ‐2,248,437 | ‐78% |
| Brazil | ‐2,214,850 | ‐92% |
| Israel | ‐2,196,238 | ‐91% |
Drastic reduction in passenger traffic amplified by travel restrictions
Number of confirmed cases and destinations with COVID‐19‐related travel restrictions
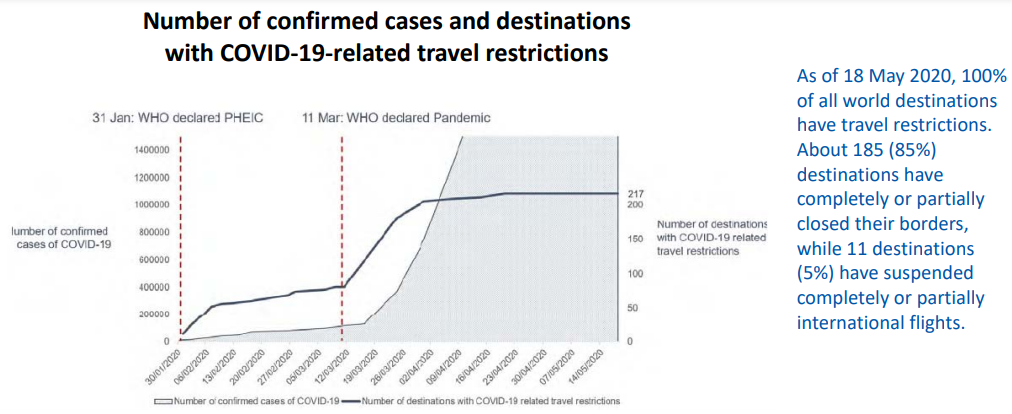
In contrast, surge in cargo flights since March 2020
In contrast to the fall in passenger traffic, cargo flights surged with the increased cargo‐only operations using passenger aircraft
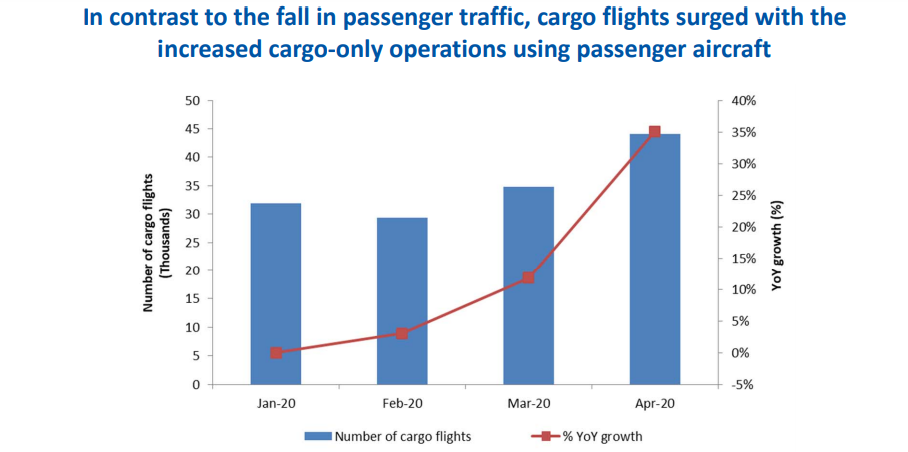
Appendix B: Scenario Assumptions in Detail
Assumptions underlying Scenarios
| (International and domestic) | Baseline (Originally‐planned, business as usual) | |
| Seat capacity | Passenger load factor | |
| January to March 2020 | Airlines' winter schedules filed with OAG as of 6 January 2020 | Forecasted 2020 load factor by region/route group, based on ICAO long‐term traffic forecasts (LTF), which was adjusted monthly by difference between 2019 actual monthly results (ICAO, IATA) and 2019 LTF forecasted load factor |
| April to September 2020 | Maximum number of seats taken from airlines' summer schedules filed with OAG during the period from 6 January 2020 to 20 April 2020 | |
| October to December 2020 | Using 2019 winter schedule as the base, and applying the pre‐COVID‐19 trend line growth, i.e. growth rate of 2019/2018 as proxy | |
| January to June 2021 | Using "2020 Baseline" as the base, and applying the baseline growth of 2020/2019, or growth rate of 2019/2018, whichever is smaller | Forecasted 2021 load factor by region/route group, based on ICAO long‐term traffic forecasts (LTF), which was adjusted monthly by difference between 2019 actual monthly results (ICAO, IATA) and 2019 LTF forecasted load factor |
| (International and domestic) |
Scenarios 1/1a, 2/2a and Reference |
|
| Seat capacity | Passenger load factor | |
| January to December 2020 | Actual capacity based on ICAO ADS‐B data | Actual estimated results by region/route group |
| January 2021 | Average 33 (international) and 19 (domestic) percentage points lower than January 2019 load factor with adjustment of GDP impact by region/route group | |
| February to June 2021 | Scenarios 1/1a & 2/2a: Application of monthly "base percentage" which incorporates impacts of intra‐/inter‐regional share difference (2019) Reference: Most recent airlines' schedules filed with OAG | Application of "base percentage" which incorporates GDP impact by region/route group |
“Base percentages” used for scenarios
| Seat capacity | Jan | Feb | Mar | Apr | May | Jun |
| Reference | ‐77% | ‐76% | ‐61% | ‐28% | ‐23% | ‐24% |
| Scenario 1 | ‐77% | ‐77% | ‐70% | ‐61% | ‐51% | ‐39% |
| Scenario 1a | ‐77% | ‐77% | ‐70% | ‐68% | ‐64% | ‐56% |
| Scenario 2 | ‐77% | ‐78% | ‐72% | ‐66% | ‐58% | ‐48% |
| Scenario 2a | ‐77% | ‐78% | ‐73% | ‐68% | ‐64% | ‐60% |
| Load factor | Jan | Feb | Mar | Apr | May | Jun |
| Reference | ‐33% | ‐28% | ‐25% | ‐21% | ‐17% | ‐15% |
| Scenario 1 | ‐33% | ‐30% | ‐27% | ‐23% | ‐19% | ‐17% |
| Scenario 1a | ‐33% | ‐30% | ‐30% | ‐30% | ‐27% | ‐25% |
| Scenario 2 | ‐33% | ‐32% | ‐29% | ‐27% | ‐25% | ‐22% |
| Scenario 2a | ‐33% | ‐33% | ‐32% | ‐32% | ‐31% | ‐29% |
| Seat capacity | Jan | Feb | Mar | Apr | May | Jun |
| Reference | ‐41% | ‐30% | ‐13% | ‐11% | ‐11% | ‐12% |
| Scenario 1 | ‐41% | ‐41% | ‐38% | ‐35% | ‐30% | ‐25% |
| Scenario 1a | ‐41% | ‐41% | ‐38% | ‐37% | ‐35% | ‐31% |
| Scenario 2 | ‐41% | ‐41% | ‐39% | ‐37% | ‐33% | ‐29% |
| Scenario 2a | ‐41% | ‐42% | ‐39% | ‐38% | ‐36% | ‐34% |
| Load factor | Jan | Feb | Mar | Apr | May | Jun |
| Reference | ‐19% | ‐14% | ‐12% | ‐10% | ‐8% | ‐6% |
| Scenario 1 | ‐19% | ‐17% | ‐14% | ‐12% | ‐10% | ‐9% |
| Scenario 1a | ‐19% | ‐17% | ‐18% | ‐19% | ‐17% | ‐16% |
| Scenario 2 | ‐19% | ‐18% | ‐17% | ‐16% | ‐15% | ‐14% |
| Scenario 2a | ‐19% | ‐19% | ‐19% | ‐19% | ‐19% | ‐18% |
- Base percentages of seat capacity already take into consideration short‐/long‐haul (intra‐/inter‐region) impacts and will be applied to Baseline level of seat capacity
- Base percentages of load factor already take into consideration economic (GDP) factors and will be added to 2019 load factor %
Data used for scenario analysis
- Seat capacity (seats available for sale): OAG airlines schedule data; Route Online; airline websites and ICAO ADS-B operational data
- Load factor (RPKs/ASKs): ICAO long-term traffic forecasts (LTF); ICAO statistical reporting forms; IATA economics data; and airline news release
- Historical passenger traffic (including ASKs, RPKs, passenger numbers and operating revenues): ICO Annual Report of the Council; and ICAO statistical reporting forms
- Yield (passenger revenues/RPK): ICAO revenue-cost analysis of airlines (RCA); and ICAO-ICM Marketing Information Data Transfer (MIDT passenger origin-destination)
- Macroeconomic factors (GDP impact): Income elasticity of demand estimated for ICAO LTF; and IMF and World Bank economic outlook data
Note 1: A list of route group is shown in Appendix C.
Note 2: Average air fares (i.e. passenger yield multiplied by average trip distance) for each region/route group are used to estimate gross passenger operating revenues.
Appendix C: Estimated Results at Route Group Level
More detailed break-down of the information is available in the COVID-19 Air Traffic Dashboard detailed break-down of the information is available in the COVID-19 Air Traffic Dashboard Covid-19 Vaccine. In case of any discrepancy and inconsistency of information contained in this Appendix and the Dashboard, the Appendix information shall prevail as the Dashboard uses non-cleaned data.
Estimated results by route group for Year 2020: Seat capacity
| Route Group | DOM/INT | Seat capacity (compared to Baseline) | Seat capacity (compared to 2019) | ||||||||||||||||||||||
| Jan 20 | Feb 20 | Mar 20 | Apr 20 | May 20 | Jun 20 | Jul 20 | Aug 20 | Sep 20 | Oct 20 | Nov 20 | Dec 20 | Jan 20 | Feb 20 | Mar 20 | Apr 20 | May 20 | Jun 20 | Jul 20 | Aug 20 | Sep 20 | Oct 20 | Nov 20 | Dec 20 | ||
| Africa | Domestic | ‐4.3% | ‐1.6% | ‐31.5% | ‐96.6% | ‐95.4% | ‐90.3% | ‐77.3% | ‐68.4% | ‐66.4% | ‐54.7% | ‐50.2% | ‐38.0% | 0.4% | 5.5% | ‐28.6% | ‐96.5% | ‐95.3% | ‐90.0% | ‐76.8% | ‐68.3% | ‐65.9% | ‐53.4% | ‐47.9% | ‐33.8% |
| Africa ‐ Asia/Pacific | International | 5.2% | ‐19.9% | ‐45.8% | ‐94.8% | ‐90.8% | ‐90.1% | ‐89.6% | ‐87.5% | ‐87.2% | ‐85.5% | ‐85.5% | ‐83.5% | 18.1% | ‐2.6% | ‐37.9% | ‐94.2% | ‐89.9% | ‐89.3% | ‐89.1% | ‐87.1% | ‐86.8% | ‐85.0% | ‐84.2% | ‐82.1% |
| Africa ‐ Middle East | International | ‐5.2% | ‐5.9% | ‐55.8% | ‐95.9% | ‐94.5% | ‐91.4% | ‐81.7% | ‐79.5% | ‐71.3% | ‐58.3% | ‐59.5% | ‐61.7% | 7.2% | 9.6% | ‐50.1% | ‐95.6% | ‐94.1% | ‐91.2% | ‐81.3% | ‐79.6% | ‐69.2% | ‐56.4% | ‐54.9% | ‐57.4% |
| Africa ‐ North America | International | ‐7.9% | ‐3.7% | ‐26.6% | ‐87.5% | ‐87.5% | ‐87.2% | ‐79.1% | ‐78.6% | ‐72.8% | ‐61.0% | ‐51.3% | ‐57.1% | 8.8% | 22.8% | ‐11.8% | ‐86.0% | ‐85.5% | ‐85.8% | ‐77.3% | ‐76.3% | ‐69.3% | ‐55.8% | ‐46.9% | ‐48.3% |
| Africa & Middle East ‐ Central America/Caribbean | International | 38.3% | |||||||||||||||||||||||
| Africa & Middle East ‐ South America | International | 0.4% | 2.4% | ‐24.6% | ‐84.1% | ‐89.6% | ‐86.4% | ‐78.1% | ‐71.5% | ‐65.5% | ‐62.6% | ‐68.4% | ‐68.6% | ‐4.9% | 1.9% | ‐26.8% | ‐81.8% | ‐87.7% | ‐84.8% | ‐77.0% | ‐69.9% | ‐64.2% | ‐64.4% | ‐70.3% | ‐70.3% |
| Central America/Caribbean | Domestic | ‐2.1% | ‐2.3% | ‐20.4% | ‐83.9% | ‐85.9% | ‐71.7% | ‐54.4% | ‐41.8% | ‐34.5% | ‐33.5% | ‐28.7% | ‐26.8% | 9.2% | 11.7% | ‐12.0% | ‐82.8% | ‐85.1% | ‐70.0% | ‐52.4% | ‐41.8% | ‐30.2% | ‐26.0% | ‐21.9% | ‐19.5% |
| Central America/Caribbean ‐ Europe | International | ‐0.2% | 1.2% | ‐18.7% | ‐94.6% | ‐91.5% | ‐89.2% | ‐78.0% | ‐72.0% | ‐73.7% | ‐62.8% | ‐69.8% | ‐56.1% | ‐1.0% | 3.5% | ‐21.0% | ‐94.4% | ‐91.2% | ‐88.9% | ‐76.9% | ‐70.7% | ‐73.4% | ‐63.5% | ‐69.9% | ‐54.8% |
| Central America/Caribbean ‐ North America | International | 2.4% | 2.2% | ‐22.2% | ‐91.5% | ‐91.7% | ‐87.4% | ‐69.9% | ‐65.0% | ‐58.6% | ‐44.3% | ‐37.2% | ‐31.3% | 0.0% | 3.9% | ‐24.4% | ‐91.5% | ‐91.5% | ‐87.4% | ‐69.7% | ‐64.9% | ‐57.5% | ‐45.9% | ‐39.0% | ‐32.6% |
| Central America/Caribbean ‐ South America | International | 2.7% | 2.7% | ‐25.7% | ‐96.6% | ‐94.8% | ‐94.7% | ‐95.3% | ‐93.8% | ‐95.9% | ‐87.8% | ‐77.2% | ‐68.2% | 0.5% | 0.6% | ‐28.4% | ‐96.4% | ‐94.5% | ‐94.4% | ‐95.2% | ‐93.7% | ‐95.7% | ‐88.0% | ‐77.1% | ‐68.2% |
| China | Domestic | ‐9.9% | ‐75.4% | ‐60.1% | ‐55.4% | ‐36.7% | ‐24.7% | ‐18.5% | ‐8.9% | ‐5.1% | 1.8% | 2.5% | 0.4% | ‐3.7% | ‐73.4% | ‐58.0% | ‐55.7% | ‐37.2% | ‐25.2% | ‐19.0% | ‐9.6% | ‐5.7% | 6.8% | 5.9% | 5.0% |
| China ‐ Europe | International | 2.6% | ‐51.8% | ‐74.6% | ‐93.2% | ‐91.0% | ‐92.2% | ‐91.9% | ‐91.5% | ‐89.9% | ‐88.9% | ‐87.4% | ‐88.1% | 4.0% | ‐48.0% | ‐73.1% | ‐93.2% | ‐91.1% | ‐92.4% | ‐91.4% | ‐91.1% | ‐89.4% | ‐88.4% | ‐86.9% | ‐87.8% |
| China ‐ Middle East | International | 2.7% | ‐56.2% | ‐77.1% | ‐91.9% | ‐95.8% | ‐82.8% | ‐78.5% | ‐77.2% | ‐80.1% | ‐80.9% | ‐86.0% | ‐84.9% | 3.8% | ‐56.4% | ‐77.1% | ‐91.8% | ‐95.6% | ‐82.6% | ‐79.0% | ‐77.7% | ‐79.7% | ‐80.8% | ‐85.8% | ‐84.5% |
| China ‐ North America | International | 0.7% | ‐46.2% | ‐67.2% | ‐92.6% | ‐87.8% | ‐90.5% | ‐87.5% | ‐89.9% | ‐88.8% | ‐86.3% | ‐83.3% | ‐84.7% | ‐5.6% | ‐48.2% | ‐70.1% | ‐92.8% | ‐88.1% | ‐90.7% | ‐87.8% | ‐90.1% | ‐89.0% | ‐87.2% | ‐84.4% | ‐85.3% |
| China & South West Asia ‐ North Asia | International | ‐0.1% | ‐43.3% | ‐84.2% | ‐89.9% | ‐88.9% | ‐91.9% | ‐90.0% | ‐89.5% | ‐88.8% | ‐90.8% | ‐94.1% | ‐94.1% | 21.7% | ‐31.8% | ‐81.5% | ‐89.4% | ‐88.6% | ‐91.5% | ‐89.4% | ‐89.1% | ‐88.5% | ‐89.6% | ‐93.0% | ‐93.0% |
| China & South West Asia ‐ Pacific South East Asia | International | ‐1.5% | ‐47.1% | ‐71.9% | ‐91.2% | ‐90.7% | ‐93.2% | ‐89.8% | ‐91.2% | ‐90.2% | ‐90.9% | ‐91.5% | ‐91.3% | 6.7% | ‐45.6% | ‐71.3% | ‐91.2% | ‐90.7% | ‐93.2% | ‐89.9% | ‐91.1% | ‐90.3% | ‐90.6% | ‐91.1% | ‐90.9% |
| Europe | Domestic | 3.2% | 2.4% | ‐30.9% | ‐88.0% | ‐86.9% | ‐68.0% | ‐37.8% | ‐22.7% | ‐30.5% | ‐32.5% | ‐46.9% | ‐43.8% | 1.5% | 1.8% | ‐32.2% | ‐88.1% | ‐87.0% | ‐68.3% | ‐38.2% | ‐23.2% | ‐31.0% | ‐33.7% | ‐47.8% | ‐45.1% |
| Europe ‐ Middle East | International | 1.5% | 0.2% | ‐43.5% | ‐89.7% | ‐89.6% | ‐84.7% | ‐81.6% | ‐79.1% | ‐73.9% | ‐73.6% | ‐74.5% | ‐72.6% | 4.9% | 6.1% | ‐42.6% | ‐89.3% | ‐88.5% | ‐84.8% | ‐81.2% | ‐78.9% | ‐74.3% | ‐72.7% | ‐73.7% | ‐71.8% |
| Europe ‐ North Africa | International | 2.6% | 0.9% | ‐41.0% | ‐97.9% | ‐96.8% | ‐95.7% | ‐76.2% | ‐71.3% | ‐76.0% | ‐73.5% | ‐75.1% | ‐68.1% | 4.0% | 7.9% | ‐41.0% | ‐97.7% | ‐96.7% | ‐95.1% | ‐74.6% | ‐69.7% | ‐74.9% | ‐73.1% | ‐75.1% | ‐67.7% |
| Europe ‐ North America | International | 3.8% | 2.3% | ‐35.9% | ‐91.4% | ‐93.6% | ‐91.6% | ‐87.2% | ‐82.8% | ‐80.8% | ‐76.3% | ‐73.3% | ‐75.1% | 0.4% | 4.1% | ‐36.2% | ‐91.3% | ‐93.5% | ‐91.4% | ‐87.0% | ‐82.5% | ‐80.4% | ‐76.9% | ‐74.1% | ‐75.8% |
| Europe ‐ North Asia | International | 5.6% | 2.2% | ‐43.4% | ‐90.0% | ‐90.9% | ‐88.8% | ‐84.8% | ‐82.2% | ‐83.1% | ‐79.7% | ‐76.7% | ‐76.1% | 6.6% | 6.4% | ‐41.9% | ‐89.4% | ‐90.4% | ‐88.3% | ‐83.7% | ‐80.8% | ‐81.6% | ‐78.9% | ‐76.3% | ‐75.9% |
| Europe ‐ Pacific South East Asia | International | ‐2.6% | 0.1% | ‐13.8% | ‐91.7% | ‐91.1% | ‐90.7% | ‐89.6% | ‐86.1% | ‐84.1% | ‐84.0% | ‐85.7% | ‐85.3% | 5.5% | 6.7% | ‐18.5% | ‐91.5% | ‐90.8% | ‐90.4% | ‐89.3% | ‐85.7% | ‐84.3% | ‐83.0% | ‐84.4% | ‐83.8% |
| Europe ‐ South America | International | ‐4.9% | ‐4.8% | ‐36.7% | ‐95.7% | ‐93.4% | ‐90.4% | ‐85.3% | ‐82.6% | ‐79.6% | ‐77.8% | ‐72.2% | ‐66.9% | ‐1.4% | 0.9% | ‐35.8% | ‐95.5% | ‐93.3% | ‐90.2% | ‐84.9% | ‐82.0% | ‐78.6% | ‐74.8% | ‐70.6% | ‐63.1% |
| Europe ‐ South West Asia | International | 1.8% | 2.7% | ‐36.4% | ‐90.2% | ‐88.8% | ‐90.7% | ‐86.6% | ‐79.4% | ‐67.9% | ‐62.9% | ‐64.5% | ‐63.1% | ‐8.3% | ‐4.1% | ‐43.0% | ‐90.2% | ‐88.1% | ‐89.8% | ‐85.6% | ‐78.1% | ‐66.2% | ‐63.7% | ‐66.7% | ‐65.8% |
| Europe ‐ Sub Saharan Africa | International | 0.7% | 0.4% | ‐28.1% | ‐90.6% | ‐91.3% | ‐87.3% | ‐78.3% | ‐68.4% | ‐60.2% | ‐50.0% | ‐53.5% | ‐46.0% | 1.1% | 5.2% | ‐27.5% | ‐90.6% | ‐90.9% | ‐87.0% | ‐78.1% | ‐68.2% | ‐59.5% | ‐49.7% | ‐54.0% | ‐45.9% |
| Intra Africa | International | ‐9.7% | ‐10.1% | ‐44.0% | ‐95.4% | ‐94.3% | ‐91.6% | ‐89.0% | ‐81.7% | ‐75.3% | ‐65.6% | ‐59.2% | ‐55.0% | 1.5% | 5.3% | ‐36.4% | ‐95.0% | ‐93.4% | ‐90.7% | ‐87.9% | ‐79.8% | ‐72.7% | ‐61.6% | ‐54.1% | ‐48.9% |
Estimated results by route group for Year 2020: Seat capacity
| Route Group | DOM/INT | Seat capacity (compared to Baseline) | Seat capacity (compared to 2019) | ||||||||||||||||||||||
| Jan 20 | Feb 20 | Mar 20 | Apr 20 | May 20 | Jun 20 | Jul 20 | Aug 20 | Sep 20 | Oct 20 | Nov 20 | Dec 20 | Jan 20 | Feb 20 | Mar 20 | Apr 20 | May 20 | Jun 20 | Jul 20 | Aug 20 | Sep 20 | Oct 20 | Nov 20 | Dec 20 | ||
| Intra Central America/Caribbean | International | 5.2% | 1.4% | ‐29.1% | ‐90.0% | ‐88.4% | ‐82.4% | ‐79.4% | ‐78.2% | ‐80.5% | ‐75.5% | ‐69.5% | ‐57.6% | 4.0% | 3.9% | ‐30.3% | ‐90.0% | ‐88.6% | ‐82.6% | ‐79.9% | ‐78.8% | ‐80.4% | ‐76.0% | ‐68.7% | ‐57.0% |
| Intra China & South West Asia | International | ‐9.6% | ‐60.5% | ‐78.8% | ‐89.0% | ‐87.1% | ‐90.2% | ‐88.3% | ‐88.3% | ‐86.0% | ‐83.9% | ‐83.7% | ‐83.4% | ‐2.0% | ‐57.0% | ‐76.9% | ‐87.7% | ‐85.4% | ‐89.0% | ‐86.8% | ‐86.9% | ‐84.4% | ‐82.4% | ‐82.7% | ‐82.5% |
| Intra Europe | International | ‐1.6% | ‐3.0% | ‐46.1% | ‐96.4% | ‐95.6% | ‐90.6% | ‐68.0% | ‐53.7% | ‐62.4% | ‐66.8% | ‐78.4% | ‐76.7% | ‐0.6% | 3.4% | ‐43.0% | ‐96.3% | ‐95.6% | ‐90.3% | ‐67.1% | ‐52.7% | ‐61.5% | ‐66.9% | ‐78.4% | ‐75.8% |
| Intra Middle East | International | ‐2.9% | ‐4.4% | ‐67.6% | ‐94.8% | ‐94.8% | ‐93.1% | ‐90.2% | ‐87.0% | ‐83.2% | ‐75.9% | ‐69.9% | ‐72.2% | 0.3% | 0.6% | ‐66.4% | ‐94.5% | ‐94.1% | ‐92.8% | ‐89.8% | ‐86.6% | ‐82.5% | ‐75.5% | ‐71.3% | ‐71.3% |
| Intra North America | International | 2.7% | 2.7% | ‐23.6% | ‐93.4% | ‐96.9% | ‐95.5% | ‐92.0% | ‐92.9% | ‐93.7% | ‐92.9% | ‐90.4% | ‐87.8% | ‐5.2% | ‐1.7% | ‐29.2% | ‐93.4% | ‐96.9% | ‐95.4% | ‐91.8% | ‐92.8% | ‐93.7% | ‐93.0% | ‐90.6% | ‐88.5% |
| Intra North Asia | International | ‐1.5% | ‐2.0% | ‐78.6% | ‐96.4% | ‐96.2% | ‐96.1% | ‐96.1% | ‐96.0% | ‐94.6% | ‐90.0% | ‐85.0% | ‐85.9% | ‐32.3% | ‐30.9% | ‐85.0% | ‐96.5% | ‐96.3% | ‐96.2% | ‐96.1% | ‐95.9% | ‐94.0% | ‐92.5% | ‐90.4% | ‐90.3% |
| Intra Pacific South East Asia | International | ‐0.6% | ‐4.8% | ‐45.3% | ‐94.9% | ‐96.0% | ‐95.7% | ‐94.9% | ‐93.8% | ‐94.2% | ‐93.6% | ‐93.5% | ‐91.8% | 7.1% | 2.0% | ‐42.7% | ‐94.7% | ‐95.8% | ‐95.6% | ‐94.8% | ‐93.6% | ‐94.0% | ‐93.5% | ‐93.2% | ‐91.4% |
| Intra South America | International | ‐8.9% | ‐0.6% | ‐37.0% | ‐96.7% | ‐95.8% | ‐95.7% | ‐96.6% | ‐96.7% | ‐96.2% | ‐89.9% | ‐82.9% | ‐76.6% | ‐9.5% | 2.5% | ‐34.8% | ‐96.4% | ‐95.3% | ‐95.1% | ‐96.3% | ‐96.2% | ‐95.7% | ‐89.7% | ‐83.4% | ‐77.8% |
| Latin America/Caribbean ‐ China | International | 2.7% | ‐88.9% | ‐100.0% | ‐100.0% | ‐66.0% | ‐100.0% | ‐100.0% | ‐100.0% | ‐100.0% | ‐100.0% | ‐97.6% | ‐97.5% | ‐100.0% | ‐92.3% | ‐100.0% | ‐100.0% | ||||||||
| Latin America/Caribbean ‐ North Asia & Pacific South East Asia | International | 2.7% | 0.9% | ‐17.4% | ‐79.4% | ‐87.0% | ‐88.3% | ‐83.7% | ‐86.2% | ‐87.1% | ‐81.3% | ‐83.9% | ‐84.5% | 2.0% | 0.7% | ‐19.3% | ‐77.8% | ‐85.2% | ‐86.6% | ‐82.0% | ‐84.6% | ‐85.2% | ‐82.4% | ‐84.4% | ‐84.3% |
| Middle East | Domestic | ‐9.4% | 5.7% | ‐37.7% | ‐95.6% | ‐94.1% | ‐74.4% | ‐61.9% | ‐51.1% | ‐47.0% | ‐30.2% | ‐20.1% | ‐18.9% | ‐15.5% | 2.0% | ‐42.2% | ‐95.6% | ‐94.1% | ‐74.6% | ‐62.2% | ‐51.4% | ‐47.4% | ‐37.6% | ‐28.9% | ‐25.4% |
| Middle East ‐ North America | International | 2.4% | 2.4% | ‐27.6% | ‐90.4% | ‐92.9% | ‐76.2% | ‐76.1% | ‐69.4% | ‐64.6% | ‐60.0% | ‐58.6% | ‐58.0% | 4.8% | 6.5% | ‐26.2% | ‐90.1% | ‐92.5% | ‐75.8% | ‐75.9% | ‐68.6% | ‐63.7% | ‐60.7% | ‐58.2% | ‐56.8% |
| Middle East ‐ North Asia & Pacific South East Asia | International | ‐0.8% | ‐1.6% | ‐35.7% | ‐82.5% | ‐85.8% | ‐76.6% | ‐72.9% | ‐69.8% | ‐69.4% | ‐70.4% | ‐70.7% | ‐71.3% | ‐0.5% | 3.4% | ‐35.0% | ‐81.4% | ‐83.8% | ‐74.8% | ‐72.5% | ‐69.2% | ‐68.4% | ‐69.8% | ‐70.9% | ‐71.2% |
| Middle East ‐ South West Asia | International | ‐2.4% | ‐0.9% | ‐43.7% | ‐96.6% | ‐93.5% | ‐82.8% | ‐73.4% | ‐71.6% | ‐65.4% | ‐63.0% | ‐59.1% | ‐54.8% | 2.9% | 9.5% | ‐39.7% | ‐96.3% | ‐92.7% | ‐81.3% | ‐71.7% | ‐70.4% | ‐63.9% | ‐61.2% | ‐56.4% | ‐51.7% |
| North America | Domestic | 2.5% | 2.7% | ‐13.9% | ‐66.8% | ‐73.6% | ‐66.3% | ‐49.2% | ‐43.6% | ‐49.1% | ‐45.1% | ‐38.9% | ‐41.1% | 4.8% | 8.3% | ‐12.4% | ‐65.6% | ‐72.5% | ‐64.3% | ‐45.6% | ‐41.5% | ‐46.0% | ‐43.5% | ‐37.7% | ‐38.8% |
| North America ‐ North Asia | International | 5.7% | 2.7% | ‐26.8% | ‐85.4% | ‐87.0% | ‐83.0% | ‐76.7% | ‐74.0% | ‐72.4% | ‐69.7% | ‐67.6% | ‐67.6% | 6.6% | 5.0% | ‐26.7% | ‐84.8% | ‐86.2% | ‐81.9% | ‐75.5% | ‐72.8% | ‐71.2% | ‐69.9% | ‐67.8% | ‐67.0% |
| North America ‐ Pacific South East Asia | International | 5.7% | 2.7% | ‐19.6% | ‐88.9% | ‐87.1% | ‐86.3% | ‐83.1% | ‐79.6% | ‐81.4% | ‐83.8% | ‐81.7% | ‐81.8% | 9.3% | 10.8% | ‐18.2% | ‐88.8% | ‐86.8% | ‐86.3% | ‐82.8% | ‐79.5% | ‐80.7% | ‐83.3% | ‐82.0% | ‐81.6% |
| North America ‐ South America | International | 2.6% | 2.7% | ‐29.2% | ‐94.2% | ‐94.9% | ‐94.6% | ‐93.0% | ‐90.5% | ‐84.9% | ‐70.2% | ‐55.5% | ‐46.1% | ‐8.0% | ‐2.8% | ‐34.1% | ‐94.1% | ‐94.8% | ‐94.3% | ‐92.5% | ‐89.9% | ‐84.1% | ‐73.1% | ‐61.1% | ‐52.2% |
| North America ‐ South West Asia | International | 1.4% | 2.6% | ‐29.9% | ‐92.1% | ‐88.3% | ‐94.8% | ‐80.2% | ‐56.3% | ‐40.8% | ‐24.8% | ‐30.7% | ‐28.4% | 20.4% | 24.4% | ‐14.9% | ‐88.7% | ‐83.0% | ‐92.4% | ‐63.1% | ‐20.0% | ‐13.7% | ‐19.6% | ‐26.7% | ‐20.8% |
| North Asia | Domestic | 1.0% | ‐1.8% | ‐18.7% | ‐54.6% | ‐68.8% | ‐57.8% | ‐38.7% | ‐23.5% | ‐46.9% | ‐36.7% | ‐27.0% | ‐25.4% | 3.1% | 2.3% | ‐18.5% | ‐54.5% | ‐68.0% | ‐57.3% | ‐37.8% | ‐23.7% | ‐46.3% | ‐35.5% | ‐25.4% | ‐24.5% |
| North Asia ‐ Pacific South East Asia | International | 0.5% | ‐6.9% | ‐63.3% | ‐89.0% | ‐88.8% | ‐86.9% | ‐87.3% | ‐89.5% | ‐86.3% | ‐87.2% | ‐86.7% | ‐86.1% | 15.9% | 9.0% | ‐59.9% | ‐88.9% | ‐88.6% | ‐86.8% | ‐87.2% | ‐88.2% | ‐86.4% | ‐85.4% | ‐84.7% | ‐83.7% |
| Pacific South East Asia | Domestic | ‐4.3% | ‐5.2% | ‐28.3% | ‐87.8% | ‐84.2% | ‐70.8% | ‐57.7% | ‐64.9% | ‐59.1% | ‐44.6% | ‐41.1% | ‐31.3% | 1.3% | 3.1% | ‐24.3% | ‐87.2% | ‐83.2% | ‐69.5% | ‐54.6% | ‐61.9% | ‐55.3% | ‐45.8% | ‐40.9% | ‐30.5% |
| South America | Domestic | 2.0% | 1.7% | ‐32.6% | ‐94.2% | ‐93.2% | ‐89.7% | ‐84.9% | ‐80.0% | ‐70.8% | ‐56.5% | ‐46.6% | ‐38.0% | 3.2% | 5.6% | ‐28.5% | ‐93.9% | ‐92.8% | ‐88.8% | ‐84.2% | ‐79.1% | ‐69.7% | ‐55.7% | ‐45.9% | ‐37.6% |
| South West Asia | Domestic | ‐3.8% | 2.2% | ‐26.2% | ‐98.7% | ‐94.0% | ‐74.8% | ‐73.4% | ‐67.9% | ‐55.1% | ‐47.1% | ‐40.7% | ‐31.2% | 0.2% | 6.6% | ‐23.0% | ‐98.7% | ‐93.8% | ‐73.7% | ‐72.3% | ‐66.5% | ‐53.2% | ‐45.2% | ‐38.2% | ‐28.5% |
| Domestic | ‐2.0% | ‐17.3% | ‐30.7% | ‐73.6% | ‐71.8% | ‐60.7% | ‐46.3% | ‐39.4% | ‐40.3% | ‐33.2% | ‐30.7% | ‐28.8% | 1.3% | ‐12.7% | ‐28.6% | ‐73.0% | ‐71.0% | ‐59.4% | ‐44.4% | ‐37.9% | ‐38.3% | ‐31.8% | ‐29.5% | ‐26.9% | |
| International | ‐0.8% | ‐10.1% | ‐47.9% | ‐93.7% | ‐93.3% | ‐90.3% | ‐78.5% | ‐71.8% | ‐73.6% | ‐73.7% | ‐76.7% | ‐74.4% | 2.0% | ‐4.9% | ‐46.2% | ‐93.5% | ‐93.1% | ‐90.0% | ‐77.8% | ‐70.9% | ‐72.8% | ‐73.2% | ‐76.3% | ‐73.5% | |
| Total | ‐1.6% | ‐14.4% | ‐37.7% | ‐82.1% | ‐80.9% | ‐73.6% | ‐60.3% | ‐53.6% | ‐54.6% | ‐50.1% | ‐49.0% | ‐47.3% | 1.6% | ‐9.6% | ‐35.7% | ‐81.6% | ‐80.3% | ‐72.7% | ‐58.9% | ‐52.3% | ‐53.2% | ‐49.1% | ‐48.1% | ‐45.7% | |
Estimated results by route group for Year 2020: Passenger number
| Route Group | DOM/INT | Scheduled passenger (thousand, compared to Baseline) | Scheduled passenger (thousand, compared to 2019) | ||||||||||||||||||||||
| Jan 20 | Feb 20 | Mar 20 | Apr 20 | May 20 | Jun 20 | Jul 20 | Aug 20 | Sep 20 | Oct 20 | Nov 20 | Dec 20 | Jan 20 | Feb 20 | Mar 20 | Apr 20 | May 20 | Jun 20 | Jul 20 | Aug 20 | Sep 20 | Oct 20 | Nov 20 | Dec 20 | ||
| Africa | Domestic | ‐213 | ‐250 | ‐1,614 | ‐3,437 | ‐3,104 | ‐3,157 | ‐3,150 | ‐2,870 | ‐2,750 | ‐2,384 | ‐2,335 | ‐2,021 | ‐41 | ‐19 | ‐1,465 | ‐3,370 | ‐2,990 | ‐3,036 | ‐3,070 | ‐2,861 | ‐2,688 | ‐2,278 | ‐2,173 | ‐1,763 |
| Africa ‐ Asia/Pacific | International | 19 | ‐92 | ‐203 | ‐356 | ‐337 | ‐343 | ‐359 | ‐360 | ‐326 | ‐321 | ‐344 | ‐369 | 61 | ‐31 | ‐155 | ‐316 | ‐304 | ‐315 | ‐342 | ‐346 | ‐315 | ‐307 | ‐310 | ‐336 |
| Africa ‐ Middle East | International | ‐50 | ‐182 | ‐1,591 | ‐2,563 | ‐2,507 | ‐2,649 | ‐2,714 | ‐2,924 | ‐2,165 | ‐1,670 | ‐1,789 | ‐2,083 | 264 | 152 | ‐1,295 | ‐2,328 | ‐2,291 | ‐2,544 | ‐2,643 | ‐2,916 | ‐1,981 | ‐1,558 | ‐1,546 | ‐1,800 |
| Africa ‐ North America | International | ‐15 | ‐14 | ‐77 | ‐183 | ‐182 | ‐231 | ‐259 | ‐272 | ‐204 | ‐154 | ‐126 | ‐175 | 17 | 22 | ‐44 | ‐162 | ‐156 | ‐205 | ‐236 | ‐242 | ‐176 | ‐129 | ‐110 | ‐132 |
| Africa & Middle East ‐ Central America/Caribbean | International | 0 | 0 | 0 | 0 | 0 | 0 | 0 | 0 | 0 | 0 | 0 | 0 | 0 | 0 | 0 | 0 | 0 | 0 | 0 | 0 | 0 | 0 | 0 | 0 |
| Africa & Middle East ‐ South America | International | 5 | 1 | ‐43 | ‐113 | ‐110 | ‐107 | ‐110 | ‐111 | ‐93 | ‐82 | ‐84 | ‐95 | ‐2 | 0 | ‐47 | ‐98 | ‐92 | ‐96 | ‐105 | ‐104 | ‐89 | ‐88 | ‐90 | ‐102 |
| Central America/Caribbean | Domestic | ‐83 | ‐139 | ‐1,641 | ‐4,325 | ‐4,461 | ‐3,869 | ‐3,481 | ‐2,509 | ‐1,610 | ‐1,783 | ‐1,533 | ‐1,589 | 420 | 427 | ‐1,181 | ‐4,020 | ‐4,191 | ‐3,582 | ‐3,254 | ‐2,502 | ‐1,331 | ‐1,268 | ‐1,093 | ‐1,105 |
| Central America/Caribbean ‐ Europe | International | 39 | ‐4 | ‐516 | ‐1,397 | ‐1,171 | ‐1,199 | ‐1,297 | ‐1,239 | ‐1,009 | ‐906 | ‐1,094 | ‐1,107 | 30 | 29 | ‐554 | ‐1,344 | ‐1,130 | ‐1,158 | ‐1,223 | ‐1,173 | ‐995 | ‐925 | ‐1,096 | ‐1,061 |
| Central America/Caribbean ‐ North America | International | 274 | ‐14 | ‐3,625 | ‐7,604 | ‐7,011 | ‐7,223 | ‐7,213 | ‐6,354 | ‐4,422 | ‐3,975 | ‐4,198 | ‐5,037 | 125 | 148 | ‐3,833 | ‐7,510 | ‐6,824 | ‐7,187 | ‐7,102 | ‐6,283 | ‐4,255 | ‐4,105 | ‐4,355 | ‐5,150 |
| Central America/Caribbean ‐ South America | International | 43 | 21 | ‐455 | ‐1,171 | ‐1,228 | ‐1,176 | ‐1,230 | ‐1,189 | ‐1,140 | ‐1,051 | ‐984 | ‐956 | 16 | ‐1 | ‐498 | ‐1,103 | ‐1,160 | ‐1,110 | ‐1,206 | ‐1,159 | ‐1,091 | ‐1,063 | ‐977 | ‐959 |
| China | Domestic | ‐8,291 | ‐45,936 | ‐36,511 | ‐30,434 | ‐23,398 | ‐18,296 | ‐14,857 | ‐10,525 | ‐4,207 | ‐2,847 | ‐3,338 | ‐5,870 | ‐4,818 | ‐41,765 | ‐33,812 | ‐30,593 | ‐23,562 | ‐18,456 | ‐15,033 | ‐10,706 | ‐4,370 | ‐171 | ‐1,634 | ‐3,588 |
| China ‐ Europe | International | 65 | ‐952 | ‐1,520 | ‐1,973 | ‐1,986 | ‐2,069 | ‐2,451 | ‐2,442 | ‐2,202 | ‐2,094 | ‐1,737 | ‐1,755 | 93 | ‐829 | ‐1,412 | ‐1,959 | ‐1,990 | ‐2,124 | ‐2,314 | ‐2,337 | ‐2,091 | ‐2,007 | ‐1,661 | ‐1,697 |
| China ‐ Middle East | International | 38 | ‐290 | ‐453 | ‐573 | ‐553 | ‐529 | ‐565 | ‐567 | ‐537 | ‐527 | ‐526 | ‐565 | 45 | ‐291 | ‐451 | ‐561 | ‐530 | ‐520 | ‐579 | ‐579 | ‐523 | ‐524 | ‐514 | ‐546 |
| China ‐ North America | International | 17 | ‐698 | ‐1,090 | ‐1,510 | ‐1,534 | ‐1,576 | ‐1,608 | ‐1,674 | ‐1,427 | ‐1,362 | ‐1,207 | ‐1,415 | ‐82 | ‐747 | ‐1,228 | ‐1,552 | ‐1,577 | ‐1,620 | ‐1,654 | ‐1,721 | ‐1,458 | ‐1,465 | ‐1,298 | ‐1,475 |
| China & South West Asia ‐ North Asia | International | ‐37 | ‐3,354 | ‐5,797 | ‐5,764 | ‐5,702 | ‐5,872 | ‐6,287 | ‐6,304 | ‐5,653 | ‐6,685 | ‐7,031 | ‐7,568 | 1,222 | ‐2,268 | ‐4,836 | ‐5,500 | ‐5,497 | ‐5,545 | ‐5,921 | ‐6,011 | ‐5,487 | ‐5,825 | ‐5,936 | ‐6,403 |
| China & South West Asia ‐ Pacific South East Asia | International | ‐223 | ‐5,407 | ‐7,839 | ‐8,923 | ‐8,767 | ‐8,893 | ‐9,306 | ‐9,632 | ‐8,473 | ‐9,247 | ‐9,278 | ‐10,117 | 660 | ‐5,086 | ‐7,592 | ‐8,907 | ‐8,701 | ‐8,829 | ‐9,302 | ‐9,493 | ‐8,466 | ‐8,919 | ‐8,737 | ‐9,647 |
| Europe | Domestic | 774 | 94 | ‐11,287 | ‐22,972 | ‐24,062 | ‐20,690 | ‐12,658 | ‐7,192 | ‐9,441 | ‐10,924 | ‐13,164 | ‐11,649 | 524 | 85 | ‐11,611 | ‐22,938 | ‐24,091 | ‐20,721 | ‐12,690 | ‐7,224 | ‐9,471 | ‐11,215 | ‐13,424 | ‐12,028 |
| Europe ‐ Middle East | International | 415 | ‐62 | ‐3,851 | ‐7,196 | ‐6,652 | ‐6,996 | ‐8,270 | ‐8,380 | ‐6,391 | ‐6,465 | ‐6,038 | ‐6,443 | 649 | 295 | ‐3,727 | ‐6,932 | ‐5,953 | ‐7,066 | ‐8,063 | ‐8,304 | ‐6,503 | ‐6,200 | ‐5,835 | ‐6,211 |
| Europe ‐ North Africa | International | 128 | ‐52 | ‐1,732 | ‐3,912 | ‐3,090 | ‐4,242 | ‐4,132 | ‐4,078 | ‐3,577 | ‐3,130 | ‐2,755 | ‐2,699 | 198 | 166 | ‐1,703 | ‐3,557 | ‐2,995 | ‐3,664 | ‐3,792 | ‐3,778 | ‐3,361 | ‐3,045 | ‐2,712 | ‐2,616 |
| Europe ‐ North America | International | 344 | 27 | ‐3,093 | ‐7,159 | ‐8,377 | ‐9,253 | ‐9,676 | ‐9,441 | ‐8,324 | ‐6,828 | ‐4,885 | ‐5,074 | 166 | 113 | ‐3,120 | ‐7,037 | ‐8,190 | ‐9,084 | ‐9,493 | ‐9,252 | ‐8,088 | ‐7,025 | ‐5,042 | ‐5,246 |
| Europe ‐ North Asia | International | 62 | ‐55 | ‐544 | ‐1,064 | ‐1,088 | ‐1,117 | ‐1,188 | ‐1,188 | ‐1,098 | ‐1,017 | ‐816 | ‐806 | 72 | ‐21 | ‐518 | ‐1,001 | ‐1,034 | ‐1,071 | ‐1,098 | ‐1,094 | ‐1,001 | ‐970 | ‐799 | ‐797 |
| Europe ‐ Pacific South East Asia | International | ‐21 | ‐150 | ‐568 | ‐1,386 | ‐1,252 | ‐1,233 | ‐1,331 | ‐1,329 | ‐1,159 | ‐1,375 | ‐1,589 | ‐1,738 | 119 | ‐45 | ‐657 | ‐1,344 | ‐1,209 | ‐1,187 | ‐1,286 | ‐1,288 | ‐1,167 | ‐1,285 | ‐1,440 | ‐1,554 |
| Europe ‐ South America | International | ‐38 | ‐77 | ‐665 | ‐1,328 | ‐1,331 | ‐1,338 | ‐1,395 | ‐1,362 | ‐1,226 | ‐1,313 | ‐1,134 | ‐1,165 | 14 | ‐3 | ‐641 | ‐1,282 | ‐1,295 | ‐1,300 | ‐1,344 | ‐1,300 | ‐1,156 | ‐1,129 | ‐1,054 | ‐1,009 |
| Europe ‐ South West Asia | International | 65 | ‐69 | ‐952 | ‐1,782 | ‐1,749 | ‐1,839 | ‐1,913 | ‐1,821 | ‐1,546 | ‐1,476 | ‐1,440 | ‐1,428 | ‐131 | ‐187 | ‐1,161 | ‐1,769 | ‐1,634 | ‐1,663 | ‐1,764 | ‐1,701 | ‐1,445 | ‐1,512 | ‐1,548 | ‐1,571 |
| Europe ‐ Sub Saharan Africa | International | 41 | ‐43 | ‐732 | ‐1,543 | ‐1,482 | ‐1,492 | ‐1,570 | ‐1,479 | ‐1,266 | ‐1,181 | ‐1,237 | ‐1,192 | 50 | 31 | ‐717 | ‐1,538 | ‐1,420 | ‐1,451 | ‐1,548 | ‐1,465 | ‐1,235 | ‐1,170 | ‐1,255 | ‐1,187 |
| Intra Africa | International | ‐234 | ‐335 | ‐1,265 | ‐2,276 | ‐2,239 | ‐2,244 | ‐2,429 | ‐2,420 | ‐2,085 | ‐1,815 | ‐1,707 | ‐1,758 | 40 | ‐14 | ‐972 | ‐2,051 | ‐1,933 | ‐2,004 | ‐2,177 | ‐2,161 | ‐1,856 | ‐1,563 | ‐1,445 | ‐1,439 |
Estimated results by route group for Year 2020: Passenger number
| Route Group | DOM/INT | Scheduled passenger (thousand, compared to Baseline) | Scheduled passenger (thousand, compared to 2019) | ||||||||||||||||||||||
| Jan 20 | Feb 20 | Mar 20 | Apr 20 | May 20 | Jun 20 | Jul 20 | Aug 20 | Sep 20 | Oct 20 | Nov 20 | Dec 20 | Jan 20 | Feb 20 | Mar 20 | Apr 20 | May 20 | Jun 20 | Jul 20 | Aug 20 | Sep 20 | Oct 20 | Nov 20 | Dec 20 | ||
| Intra Central America/Caribbean | International | 78 | 2 | ‐571 | ‐1,257 | ‐1,319 | ‐1,227 | ‐1,257 | ‐1,229 | ‐1,161 | ‐1,107 | ‐1,095 | ‐1,004 | 68 | 37 | ‐590 | ‐1,255 | ‐1,330 | ‐1,236 | ‐1,288 | ‐1,261 | ‐1,149 | ‐1,129 | ‐1,053 | ‐980 |
| Intra China & South West Asia | International | ‐475 | ‐2,946 | ‐3,919 | ‐4,492 | ‐4,401 | ‐4,460 | ‐4,743 | ‐4,862 | ‐4,091 | ‐4,149 | ‐3,817 | ‐3,987 | ‐90 | ‐2,565 | ‐3,515 | ‐3,989 | ‐3,834 | ‐3,935 | ‐4,151 | ‐4,266 | ‐3,626 | ‐3,756 | ‐3,569 | ‐3,763 |
| Intra Europe | International | 265 | ‐2,090 | ‐28,271 | ‐57,483 | ‐61,572 | ‐67,650 | ‐61,485 | ‐54,274 | ‐53,952 | ‐50,915 | ‐39,403 | ‐40,319 | 1,046 | 864 | ‐25,217 | ‐55,462 | ‐61,145 | ‐64,565 | ‐58,835 | ‐52,066 | ‐51,885 | ‐50,505 | ‐39,098 | ‐38,128 |
| Intra Middle East | International | 65 | ‐168 | ‐2,606 | ‐3,632 | ‐3,328 | ‐3,632 | ‐3,867 | ‐4,098 | ‐3,255 | ‐2,955 | ‐2,549 | ‐3,120 | 197 | 8 | ‐2,462 | ‐3,442 | ‐2,943 | ‐3,454 | ‐3,674 | ‐3,939 | ‐3,086 | ‐2,891 | ‐2,678 | ‐2,998 |
| Intra North America | International | 98 | 1 | ‐1,219 | ‐2,673 | ‐2,588 | ‐2,828 | ‐2,992 | ‐2,984 | ‐2,535 | ‐2,519 | ‐2,294 | ‐2,408 | ‐98 | ‐92 | ‐1,427 | ‐2,687 | ‐2,630 | ‐2,770 | ‐2,917 | ‐2,947 | ‐2,503 | ‐2,552 | ‐2,350 | ‐2,547 |
| Intra North Asia | International | ‐21 | ‐212 | ‐1,050 | ‐1,632 | ‐1,629 | ‐1,643 | ‐1,812 | ‐1,765 | ‐1,321 | ‐808 | ‐615 | ‐771 | ‐589 | ‐688 | ‐1,575 | ‐1,675 | ‐1,672 | ‐1,686 | ‐1,808 | ‐1,714 | ‐1,193 | ‐1,090 | ‐996 | ‐1,146 |
| Intra Pacific South East Asia | International | ‐39 | ‐1,487 | ‐4,730 | ‐7,559 | ‐7,409 | ‐7,504 | ‐8,000 | ‐7,891 | ‐7,184 | ‐7,485 | ‐7,517 | ‐8,205 | 562 | ‐988 | ‐4,371 | ‐7,296 | ‐7,010 | ‐7,227 | ‐7,795 | ‐7,621 | ‐6,979 | ‐7,274 | ‐7,220 | ‐7,871 |
| Intra South America | International | ‐161 | ‐31 | ‐834 | ‐1,595 | ‐1,631 | ‐1,574 | ‐1,816 | ‐1,749 | ‐1,603 | ‐1,356 | ‐1,270 | ‐1,296 | ‐164 | 28 | ‐768 | ‐1,435 | ‐1,442 | ‐1,372 | ‐1,689 | ‐1,494 | ‐1,373 | ‐1,310 | ‐1,304 | ‐1,368 |
| Latin America/Caribbean ‐ China | International | 0 | 0 | 0 | 0 | 0 | 0 | 0 | 0 | 0 | ‐5 | ‐8 | ‐4 | ‐5 | ‐7 | ‐8 | ‐9 | ‐9 | ‐9 | ‐8 | ‐8 | ‐8 | ‐7 | ‐8 | ‐6 |
| Latin America/Caribbean ‐ North Asia & Pacific South East Asia | International | 2 | ‐4 | ‐27 | ‐65 | ‐68 | ‐68 | ‐72 | ‐69 | ‐66 | ‐55 | ‐58 | ‐71 | 2 | ‐4 | ‐28 | ‐59 | ‐59 | ‐58 | ‐65 | ‐61 | ‐57 | ‐59 | ‐60 | ‐70 |
| Middle East | Domestic | ‐115 | 128 | ‐1,597 | ‐3,353 | ‐3,240 | ‐2,792 | ‐2,855 | ‐2,653 | ‐2,151 | ‐1,564 | ‐1,327 | ‐1,462 | ‐343 | 30 | ‐1,831 | ‐3,369 | ‐3,256 | ‐2,808 | ‐2,873 | ‐2,671 | ‐2,166 | ‐1,889 | ‐1,647 | ‐1,717 |
| Middle East ‐ North America | International | 54 | 12 | ‐300 | ‐729 | ‐719 | ‐715 | ‐782 | ‐775 | ‐631 | ‐557 | ‐549 | ‐621 | 71 | 37 | ‐285 | ‐705 | ‐679 | ‐700 | ‐772 | ‐751 | ‐612 | ‐570 | ‐541 | ‐597 |
| Middle East ‐ North Asia & Pacific South East Asia | International | 84 | ‐87 | ‐1,111 | ‐2,231 | ‐2,042 | ‐1,940 | ‐2,047 | ‐2,077 | ‐1,791 | ‐1,844 | ‐1,810 | ‐2,096 | 98 | 20 | ‐1,080 | ‐2,082 | ‐1,765 | ‐1,782 | ‐2,008 | ‐2,021 | ‐1,720 | ‐1,795 | ‐1,823 | ‐2,088 |
| Middle East ‐ South West Asia | International | 23 | ‐342 | ‐2,620 | ‐4,759 | ‐4,524 | ‐4,284 | ‐4,417 | ‐4,455 | ‐3,850 | ‐3,817 | ‐3,800 | ‐3,998 | 286 | 84 | ‐2,294 | ‐4,346 | ‐4,017 | ‐3,897 | ‐4,103 | ‐4,223 | ‐3,641 | ‐3,590 | ‐3,494 | ‐3,643 |
| North America | Domestic | 2,855 | 2,299 | ‐36,263 | ‐68,107 | ‐67,926 | ‐64,227 | ‐60,878 | ‐53,472 | ‐45,688 | ‐44,294 | ‐39,136 | ‐46,763 | 4,448 | 5,665 | ‐34,681 | ‐65,198 | ‐64,327 | ‐59,496 | ‐54,969 | ‐50,265 | ‐41,298 | ‐41,904 | ‐37,597 | ‐43,687 |
| North America ‐ North Asia | International | 82 | ‐109 | ‐623 | ‐1,320 | ‐1,387 | ‐1,390 | ‐1,413 | ‐1,418 | ‐1,267 | ‐1,200 | ‐1,073 | ‐1,207 | 95 | ‐81 | ‐618 | ‐1,263 | ‐1,298 | ‐1,298 | ‐1,333 | ‐1,347 | ‐1,203 | ‐1,207 | ‐1,078 | ‐1,180 |
| North America ‐ Pacific South East Asia | International | 45 | ‐63 | ‐293 | ‐634 | ‐641 | ‐644 | ‐690 | ‐649 | ‐605 | ‐622 | ‐574 | ‐711 | 73 | ‐13 | ‐279 | ‐625 | ‐623 | ‐642 | ‐678 | ‐644 | ‐580 | ‐601 | ‐580 | ‐699 |
| North America ‐ South America | International | 47 | 7 | ‐613 | ‐1,242 | ‐1,305 | ‐1,341 | ‐1,443 | ‐1,396 | ‐1,170 | ‐914 | ‐748 | ‐835 | ‐107 | ‐56 | ‐705 | ‐1,228 | ‐1,266 | ‐1,263 | ‐1,330 | ‐1,296 | ‐1,098 | ‐1,022 | ‐889 | ‐986 |
| North America ‐ South West Asia | International | 4 | ‐13 | ‐93 | ‐181 | ‐176 | ‐180 | ‐179 | ‐157 | ‐135 | ‐115 | ‐117 | ‐138 | 34 | 18 | ‐59 | ‐124 | ‐119 | ‐122 | ‐88 | ‐69 | ‐79 | ‐104 | ‐107 | ‐118 |
| North Asia | Domestic | 210 | ‐1,056 | ‐6,777 | ‐9,069 | ‐9,925 | ‐7,536 | ‐6,969 | ‐8,561 | ‐7,211 | ‐5,804 | ‐4,870 | ‐5,822 | 502 | ‐568 | ‐6,649 | ‐8,965 | ‐9,557 | ‐7,318 | ‐6,707 | ‐8,482 | ‐6,971 | ‐5,458 | ‐4,510 | ‐5,594 |
| North Asia ‐ Pacific South East Asia | International | 8 | ‐1,012 | ‐3,350 | ‐3,848 | ‐3,806 | ‐3,725 | ‐3,993 | ‐4,701 | ‐3,640 | ‐4,433 | ‐4,517 | ‐5,197 | 673 | ‐344 | ‐2,952 | ‐3,785 | ‐3,709 | ‐3,681 | ‐3,927 | ‐4,140 | ‐3,639 | ‐3,831 | ‐3,901 | ‐4,373 |
| Pacific South East Asia | Domestic | ‐786 | ‐2,279 | ‐11,446 | ‐24,661 | ‐23,087 | ‐21,457 | ‐21,679 | ‐23,446 | ‐19,695 | ‐15,935 | ‐15,526 | ‐14,976 | 691 | ‐321 | ‐10,010 | ‐23,264 | ‐21,551 | ‐20,281 | ‐19,644 | ‐21,198 | ‐17,380 | ‐16,498 | ‐15,399 | ‐14,601 |
| South America | Domestic | 471 | 15 | ‐6,153 | ‐13,280 | ‐13,651 | ‐13,034 | ‐14,018 | ‐12,284 | ‐10,267 | ‐8,806 | ‐6,460 | ‐6,139 | 796 | 641 | ‐5,174 | ‐12,448 | ‐12,652 | ‐11,712 | ‐13,226 | ‐11,519 | ‐9,653 | ‐8,397 | ‐6,149 | ‐5,906 |
| South West Asia | Domestic | ‐758 | ‐306 | ‐5,166 | ‐13,140 | ‐13,707 | ‐11,926 | ‐11,384 | ‐10,391 | ‐8,168 | ‐7,599 | ‐7,900 | ‐7,037 | 40 | 434 | ‐4,402 | ‐12,408 | ‐12,916 | ‐11,141 | ‐10,587 | ‐9,618 | ‐7,420 | ‐6,914 | ‐7,060 | ‐6,221 |
| Domestic | ‐5,937 | ‐47,430 | ‐118,454 | ‐192,778 | ‐186,560 | ‐166,983 | ‐151,928 | ‐133,905 | ‐111,188 | ‐101,940 | ‐95,589 | ‐103,327 | 2,221 | ‐35,393 | ‐110,817 | ‐186,575 | ‐179,093 | ‐158,550 | ‐142,053 | ‐127,045 | ‐102,747 | ‐95,992 | ‐90,686 | ‐96,210 | |
| International | 1,092 | ‐20,347 | ‐88,841 | ‐155,108 | ‐156,894 | ‐166,425 | ‐166,311 | ‐159,111 | ‐142,582 | ‐137,531 | ‐121,812 | ‐129,533 | 5,782 | ‐12,309 | ‐83,396 | ‐149,319 | ‐151,466 | ‐159,440 | ‐159,657 | ‐152,577 | ‐137,171 | ‐134,106 | ‐118,509 | ‐123,494 | |
| Total | ‐4,844 | ‐67,777 | ‐207,295 | ‐347,886 | ‐343,454 | ‐333,409 | ‐318,239 | ‐293,015 | ‐253,770 | ‐239,471 | ‐217,400 | ‐232,860 | 8,003 | ‐47,702 | ‐194,213 | ‐335,894 | ‐330,559 | ‐317,991 | ‐301,710 | ‐279,622 | ‐239,918 | ‐230,098 | ‐209,195 | ‐219,705 | |
Estimated results by route group for Year 2020: Passenger revenues
| Route Group | DOM/INT | Gross revenue (USD, million, compared to Baseline) | Gross revenue (USD, million, compared to 2019) | ||||||||||||||||||||||
| Jan 20 | Feb 20 | Mar 20 | Apr 20 | May 20 | Jun 20 | Jul 20 | Aug 20 | Sep 20 | Oct 20 | Nov 20 | Dec 20 | Jan 20 | Feb 20 | Mar 20 | Apr 20 | May 20 | Jun 20 | Jul 20 | Aug 20 | Sep 20 | Oct 20 | Nov 20 | Dec 20 | ||
| Africa | Domestic | ‐19 | ‐23 | ‐146 | ‐312 | ‐281 | ‐286 | ‐286 | ‐260 | ‐249 | ‐216 | ‐212 | ‐183 | ‐4 | ‐2 | ‐133 | ‐305 | ‐271 | ‐275 | ‐278 | ‐259 | ‐244 | ‐207 | ‐197 | ‐160 |
| Africa ‐ Asia/Pacific | International | 11 | ‐52 | ‐114 | ‐200 | ‐189 | ‐192 | ‐202 | ‐202 | ‐183 | ‐180 | ‐193 | ‐207 | 34 | ‐18 | ‐87 | ‐177 | ‐170 | ‐177 | ‐192 | ‐194 | ‐177 | ‐172 | ‐174 | ‐188 |
| Africa ‐ Middle East | International | ‐11 | ‐40 | ‐354 | ‐570 | ‐557 | ‐589 | ‐603 | ‐650 | ‐481 | ‐371 | ‐398 | ‐463 | 59 | 34 | ‐288 | ‐518 | ‐509 | ‐565 | ‐588 | ‐648 | ‐440 | ‐346 | ‐344 | ‐400 |
| Africa ‐ North America | International | ‐11 | ‐11 | ‐57 | ‐137 | ‐136 | ‐172 | ‐194 | ‐203 | ‐152 | ‐115 | ‐94 | ‐130 | 13 | 17 | ‐33 | ‐121 | ‐117 | ‐154 | ‐176 | ‐181 | ‐132 | ‐97 | ‐82 | ‐99 |
| Africa & Middle East ‐ Central America/Caribbean | International | 0 | 0 | 0 | 0 | 0 | 0 | 0 | 0 | 0 | 0 | 0 | 0 | 0 | 0 | 0 | 0 | 0 | 0 | 0 | 0 | 0 | 0 | 0 | 0 |
| Africa & Middle East ‐ South America | International | 2 | 0 | ‐18 | ‐48 | ‐47 | ‐45 | ‐47 | ‐47 | ‐39 | ‐35 | ‐35 | ‐40 | ‐1 | 0 | ‐20 | ‐41 | ‐39 | ‐41 | ‐44 | ‐44 | ‐38 | ‐37 | ‐38 | ‐43 |
| Central America/Caribbean | Domestic | ‐6 | ‐11 | ‐125 | ‐329 | ‐340 | ‐295 | ‐265 | ‐191 | ‐123 | ‐136 | ‐117 | ‐121 | 32 | 32 | ‐90 | ‐306 | ‐319 | ‐273 | ‐248 | ‐190 | ‐101 | ‐97 | ‐83 | ‐84 |
| Central America/Caribbean ‐ Europe | International | 13 | ‐1 | ‐179 | ‐485 | ‐406 | ‐416 | ‐450 | ‐430 | ‐350 | ‐314 | ‐379 | ‐384 | 11 | 10 | ‐192 | ‐466 | ‐392 | ‐402 | ‐424 | ‐407 | ‐345 | ‐321 | ‐380 | ‐368 |
| Central America/Caribbean ‐ North America | International | 44 | ‐2 | ‐577 | ‐1,211 | ‐1,117 | ‐1,150 | ‐1,149 | ‐1,012 | ‐704 | ‐633 | ‐669 | ‐802 | 20 | 24 | ‐611 | ‐1,196 | ‐1,087 | ‐1,145 | ‐1,131 | ‐1,001 | ‐678 | ‐654 | ‐694 | ‐820 |
| Central America/Caribbean ‐ South America | International | 8 | 4 | ‐84 | ‐217 | ‐228 | ‐218 | ‐228 | ‐220 | ‐211 | ‐195 | ‐182 | ‐177 | 3 | 0 | ‐92 | ‐204 | ‐215 | ‐206 | ‐223 | ‐215 | ‐202 | ‐197 | ‐181 | ‐178 |
| China | Domestic | ‐741 | ‐4,103 | ‐3,261 | ‐2,718 | ‐2,090 | ‐1,634 | ‐1,327 | ‐940 | ‐376 | ‐254 | ‐298 | ‐524 | ‐430 | ‐3,730 | ‐3,020 | ‐2,733 | ‐2,105 | ‐1,649 | ‐1,343 | ‐956 | ‐390 | ‐15 | ‐146 | ‐320 |
| China ‐ Europe | International | 20 | ‐293 | ‐468 | ‐608 | ‐612 | ‐637 | ‐755 | ‐752 | ‐678 | ‐645 | ‐535 | ‐541 | 29 | ‐255 | ‐435 | ‐603 | ‐613 | ‐654 | ‐713 | ‐720 | ‐644 | ‐618 | ‐512 | ‐523 |
| China ‐ Middle East | International | 9 | ‐72 | ‐113 | ‐143 | ‐137 | ‐132 | ‐141 | ‐141 | ‐134 | ‐131 | ‐131 | ‐141 | 11 | ‐72 | ‐112 | ‐140 | ‐132 | ‐129 | ‐144 | ‐144 | ‐130 | ‐130 | ‐128 | ‐136 |
| China ‐ North America | International | 7 | ‐284 | ‐444 | ‐615 | ‐625 | ‐642 | ‐655 | ‐682 | ‐581 | ‐555 | ‐492 | ‐577 | ‐33 | ‐304 | ‐500 | ‐632 | ‐642 | ‐660 | ‐674 | ‐701 | ‐594 | ‐597 | ‐529 | ‐601 |
| China & South West Asia ‐ North Asia | International | ‐7 | ‐606 | ‐1,046 | ‐1,040 | ‐1,029 | ‐1,060 | ‐1,135 | ‐1,138 | ‐1,020 | ‐1,207 | ‐1,269 | ‐1,366 | 221 | ‐409 | ‐873 | ‐993 | ‐992 | ‐1,001 | ‐1,069 | ‐1,085 | ‐991 | ‐1,052 | ‐1,072 | ‐1,156 |
| China & South West Asia ‐ Pacific South East Asia | International | ‐49 | ‐1,188 | ‐1,722 | ‐1,960 | ‐1,926 | ‐1,954 | ‐2,044 | ‐2,116 | ‐1,861 | ‐2,031 | ‐2,038 | ‐2,223 | 145 | ‐1,117 | ‐1,668 | ‐1,957 | ‐1,912 | ‐1,940 | ‐2,043 | ‐2,085 | ‐1,860 | ‐1,959 | ‐1,919 | ‐2,119 |
| Europe | Domestic | 64 | 8 | ‐928 | ‐1,889 | ‐1,978 | ‐1,701 | ‐1,041 | ‐591 | ‐776 | ‐898 | ‐1,082 | ‐958 | 43 | 7 | ‐955 | ‐1,886 | ‐1,981 | ‐1,704 | ‐1,043 | ‐594 | ‐779 | ‐922 | ‐1,104 | ‐989 |
| Europe ‐ Middle East | International | 78 | ‐12 | ‐719 | ‐1,344 | ‐1,242 | ‐1,307 | ‐1,545 | ‐1,565 | ‐1,194 | ‐1,208 | ‐1,128 | ‐1,203 | 121 | 55 | ‐696 | ‐1,295 | ‐1,112 | ‐1,320 | ‐1,506 | ‐1,551 | ‐1,215 | ‐1,158 | ‐1,090 | ‐1,160 |
| Europe ‐ North Africa | International | 19 | ‐8 | ‐259 | ‐585 | ‐462 | ‐635 | ‐618 | ‐610 | ‐535 | ‐468 | ‐412 | ‐404 | 30 | 25 | ‐255 | ‐532 | ‐448 | ‐548 | ‐567 | ‐565 | ‐503 | ‐456 | ‐406 | ‐391 |
| Europe ‐ North America | International | 109 | 9 | ‐985 | ‐2,281 | ‐2,669 | ‐2,948 | ‐3,082 | ‐3,007 | ‐2,652 | ‐2,175 | ‐1,556 | ‐1,616 | 53 | 36 | ‐994 | ‐2,242 | ‐2,609 | ‐2,894 | ‐3,024 | ‐2,947 | ‐2,576 | ‐2,238 | ‐1,606 | ‐1,671 |
| Europe ‐ North Asia | International | 30 | ‐26 | ‐259 | ‐506 | ‐518 | ‐532 | ‐565 | ‐565 | ‐522 | ‐484 | ‐388 | ‐384 | 34 | ‐10 | ‐246 | ‐476 | ‐492 | ‐509 | ‐522 | ‐521 | ‐477 | ‐461 | ‐380 | ‐379 |
| Europe ‐ Pacific South East Asia | International | ‐11 | ‐76 | ‐288 | ‐703 | ‐635 | ‐625 | ‐675 | ‐674 | ‐588 | ‐697 | ‐806 | ‐881 | 60 | ‐23 | ‐333 | ‐682 | ‐613 | ‐602 | ‐652 | ‐653 | ‐592 | ‐652 | ‐730 | ‐788 |
| Europe ‐ South America | International | ‐14 | ‐28 | ‐241 | ‐482 | ‐483 | ‐486 | ‐506 | ‐494 | ‐445 | ‐476 | ‐412 | ‐423 | 5 | ‐1 | ‐233 | ‐465 | ‐470 | ‐472 | ‐488 | ‐472 | ‐420 | ‐410 | ‐383 | ‐366 |
| Europe ‐ South West Asia | International | 18 | ‐19 | ‐261 | ‐488 | ‐479 | ‐503 | ‐524 | ‐498 | ‐423 | ‐404 | ‐394 | ‐391 | ‐36 | ‐51 | ‐318 | ‐484 | ‐447 | ‐455 | ‐483 | ‐465 | ‐396 | ‐414 | ‐424 | ‐430 |
| Europe ‐ Sub Saharan Africa | International | 17 | ‐19 | ‐315 | ‐663 | ‐637 | ‐641 | ‐675 | ‐636 | ‐544 | ‐507 | ‐532 | ‐512 | 21 | 13 | ‐308 | ‐661 | ‐610 | ‐623 | ‐665 | ‐629 | ‐531 | ‐503 | ‐539 | ‐510 |
| Intra Africa | International | ‐31 | ‐44 | ‐168 | ‐302 | ‐297 | ‐297 | ‐322 | ‐321 | ‐276 | ‐240 | ‐226 | ‐233 | 5 | ‐2 | ‐129 | ‐272 | ‐256 | ‐266 | ‐288 | ‐286 | ‐246 | ‐207 | ‐191 | ‐191 |
Estimated results by route group for Year 2020: Passenger revenues
| Route Group | DOM/INT | Gross revenue (USD, million, compared to Baseline) | Gross revenue (USD, million, compared to 2019) | ||||||||||||||||||||||
| Jan 20 | Feb 20 | Mar 20 | Apr 20 | May 20 | Jun 20 | Jul 20 | Aug 20 | Sep 20 | Oct 20 | Nov 20 | Dec 20 | Jan 20 | Feb 20 | Mar 20 | Apr 20 | May 20 | Jun 20 | Jul 20 | Aug 20 | Sep 20 | Oct 20 | Nov 20 | Dec 20 | ||
| Intra Central America/Caribbean | International | 7 | 0 | ‐48 | ‐106 | ‐112 | ‐104 | ‐106 | ‐104 | ‐98 | ‐94 | ‐93 | ‐85 | 6 | 3 | ‐50 | ‐106 | ‐112 | ‐104 | ‐109 | ‐107 | ‐97 | ‐96 | ‐89 | ‐83 |
| Intra China & South West Asia | International | ‐61 | ‐381 | ‐506 | ‐580 | ‐568 | ‐576 | ‐613 | ‐628 | ‐528 | ‐536 | ‐493 | ‐515 | ‐12 | ‐331 | ‐454 | ‐515 | ‐495 | ‐508 | ‐536 | ‐551 | ‐468 | ‐485 | ‐461 | ‐486 |
| Intra Europe | International | 27 | ‐216 | ‐2,921 | ‐5,940 | ‐6,363 | ‐6,991 | ‐6,354 | ‐5,608 | ‐5,575 | ‐5,261 | ‐4,072 | ‐4,166 | 108 | 89 | ‐2,606 | ‐5,731 | ‐6,319 | ‐6,672 | ‐6,080 | ‐5,380 | ‐5,362 | ‐5,219 | ‐4,040 | ‐3,940 |
| Intra Middle East | International | 8 | ‐20 | ‐303 | ‐422 | ‐387 | ‐422 | ‐449 | ‐476 | ‐378 | ‐343 | ‐296 | ‐362 | 23 | 1 | ‐286 | ‐400 | ‐342 | ‐401 | ‐427 | ‐458 | ‐359 | ‐336 | ‐311 | ‐348 |
| Intra North America | International | 13 | 0 | ‐165 | ‐362 | ‐351 | ‐383 | ‐405 | ‐404 | ‐343 | ‐341 | ‐311 | ‐326 | ‐13 | ‐12 | ‐193 | ‐364 | ‐356 | ‐375 | ‐395 | ‐399 | ‐339 | ‐346 | ‐318 | ‐345 |
| Intra North Asia | International | ‐1 | ‐12 | ‐57 | ‐89 | ‐89 | ‐90 | ‐99 | ‐96 | ‐72 | ‐44 | ‐34 | ‐42 | ‐32 | ‐38 | ‐86 | ‐91 | ‐91 | ‐92 | ‐99 | ‐93 | ‐65 | ‐59 | ‐54 | ‐63 |
| Intra Pacific South East Asia | International | ‐6 | ‐225 | ‐715 | ‐1,142 | ‐1,120 | ‐1,134 | ‐1,209 | ‐1,192 | ‐1,086 | ‐1,131 | ‐1,136 | ‐1,240 | 85 | ‐149 | ‐661 | ‐1,103 | ‐1,059 | ‐1,092 | ‐1,178 | ‐1,152 | ‐1,055 | ‐1,099 | ‐1,091 | ‐1,189 |
| Intra South America | International | ‐28 | ‐5 | ‐147 | ‐281 | ‐288 | ‐277 | ‐320 | ‐308 | ‐283 | ‐239 | ‐224 | ‐229 | ‐29 | 5 | ‐135 | ‐253 | ‐254 | ‐242 | ‐298 | ‐263 | ‐242 | ‐231 | ‐230 | ‐241 |
| Latin America/Caribbean ‐ China | International | 0 | 0 | 0 | 0 | 0 | 0 | 0 | 0 | 0 | ‐4 | ‐6 | ‐3 | ‐4 | ‐6 | ‐6 | ‐7 | ‐7 | ‐7 | ‐6 | ‐6 | ‐6 | ‐6 | ‐6 | ‐4 |
| Latin America/Caribbean ‐ North Asia & Pacific South East Asia | International | 1 | ‐3 | ‐18 | ‐44 | ‐47 | ‐47 | ‐50 | ‐47 | ‐46 | ‐38 | ‐40 | ‐49 | 1 | ‐3 | ‐19 | ‐41 | ‐40 | ‐40 | ‐44 | ‐42 | ‐39 | ‐41 | ‐41 | ‐48 |
| Middle East | Domestic | ‐11 | 12 | ‐151 | ‐317 | ‐306 | ‐264 | ‐270 | ‐251 | ‐203 | ‐148 | ‐125 | ‐138 | ‐32 | 3 | ‐173 | ‐318 | ‐308 | ‐265 | ‐272 | ‐252 | ‐205 | ‐179 | ‐156 | ‐162 |
| Middle East ‐ North America | International | 26 | 6 | ‐145 | ‐352 | ‐347 | ‐345 | ‐377 | ‐374 | ‐305 | ‐269 | ‐265 | ‐299 | 34 | 18 | ‐138 | ‐340 | ‐328 | ‐338 | ‐372 | ‐363 | ‐295 | ‐275 | ‐261 | ‐288 |
| Middle East ‐ North Asia & Pacific South East Asia | International | 23 | ‐24 | ‐302 | ‐606 | ‐555 | ‐527 | ‐556 | ‐564 | ‐487 | ‐501 | ‐492 | ‐570 | 27 | 6 | ‐294 | ‐566 | ‐480 | ‐484 | ‐546 | ‐549 | ‐467 | ‐488 | ‐495 | ‐568 |
| Middle East ‐ South West Asia | International | 4 | ‐55 | ‐420 | ‐763 | ‐725 | ‐687 | ‐708 | ‐714 | ‐617 | ‐612 | ‐609 | ‐641 | 46 | 13 | ‐368 | ‐697 | ‐644 | ‐625 | ‐658 | ‐677 | ‐584 | ‐575 | ‐560 | ‐584 |
| North America | Domestic | 336 | 271 | ‐4,273 | ‐8,026 | ‐8,004 | ‐7,569 | ‐7,174 | ‐6,301 | ‐5,384 | ‐5,220 | ‐4,612 | ‐5,511 | 524 | 668 | ‐4,087 | ‐7,683 | ‐7,580 | ‐7,011 | ‐6,478 | ‐5,923 | ‐4,867 | ‐4,938 | ‐4,430 | ‐5,148 |
| North America ‐ North Asia | International | 26 | ‐35 | ‐199 | ‐423 | ‐444 | ‐445 | ‐452 | ‐454 | ‐405 | ‐384 | ‐344 | ‐386 | 30 | ‐26 | ‐198 | ‐404 | ‐416 | ‐416 | ‐427 | ‐431 | ‐385 | ‐386 | ‐345 | ‐378 |
| North America ‐ Pacific South East Asia | International | 37 | ‐51 | ‐237 | ‐513 | ‐519 | ‐521 | ‐559 | ‐526 | ‐490 | ‐504 | ‐464 | ‐576 | 59 | ‐11 | ‐226 | ‐506 | ‐504 | ‐520 | ‐549 | ‐521 | ‐469 | ‐486 | ‐469 | ‐566 |
| North America ‐ South America | International | 19 | 3 | ‐245 | ‐497 | ‐522 | ‐536 | ‐577 | ‐558 | ‐468 | ‐365 | ‐299 | ‐334 | ‐43 | ‐23 | ‐282 | ‐491 | ‐506 | ‐505 | ‐532 | ‐518 | ‐439 | ‐409 | ‐356 | ‐395 |
| North America ‐ South West Asia | International | 3 | ‐10 | ‐69 | ‐136 | ‐132 | ‐135 | ‐134 | ‐118 | ‐101 | ‐86 | ‐87 | ‐104 | 26 | 13 | ‐44 | ‐93 | ‐89 | ‐91 | ‐66 | ‐52 | ‐59 | ‐78 | ‐80 | ‐88 |
| North Asia | Domestic | 11 | ‐54 | ‐344 | ‐460 | ‐504 | ‐382 | ‐354 | ‐434 | ‐366 | ‐295 | ‐247 | ‐295 | 25 | ‐29 | ‐337 | ‐455 | ‐485 | ‐371 | ‐340 | ‐430 | ‐354 | ‐277 | ‐229 | ‐284 |
| North Asia ‐ Pacific South East Asia | International | 2 | ‐265 | ‐879 | ‐1,009 | ‐998 | ‐977 | ‐1,047 | ‐1,233 | ‐955 | ‐1,162 | ‐1,184 | ‐1,363 | 177 | ‐90 | ‐774 | ‐993 | ‐973 | ‐965 | ‐1,030 | ‐1,086 | ‐954 | ‐1,004 | ‐1,023 | ‐1,147 |
| Pacific South East Asia | Domestic | ‐49 | ‐142 | ‐712 | ‐1,534 | ‐1,436 | ‐1,335 | ‐1,348 | ‐1,458 | ‐1,225 | ‐991 | ‐966 | ‐932 | 43 | ‐20 | ‐623 | ‐1,447 | ‐1,341 | ‐1,261 | ‐1,222 | ‐1,318 | ‐1,081 | ‐1,026 | ‐958 | ‐908 |
| South America | Domestic | 40 | 1 | ‐527 | ‐1,138 | ‐1,169 | ‐1,116 | ‐1,201 | ‐1,052 | ‐879 | ‐754 | ‐553 | ‐526 | 68 | 55 | ‐443 | ‐1,066 | ‐1,084 | ‐1,003 | ‐1,133 | ‐987 | ‐827 | ‐719 | ‐527 | ‐506 |
| South West Asia | Domestic | ‐47 | ‐19 | ‐321 | ‐817 | ‐853 | ‐742 | ‐708 | ‐646 | ‐508 | ‐473 | ‐491 | ‐438 | 3 | 27 | ‐274 | ‐772 | ‐803 | ‐693 | ‐658 | ‐598 | ‐462 | ‐430 | ‐439 | ‐387 |
| Domestic | ‐422 | ‐4,059 | ‐10,789 | ‐17,540 | ‐16,961 | ‐15,324 | ‐13,973 | ‐12,126 | ‐10,089 | ‐9,384 | ‐8,704 | ‐9,625 | 272 | ‐2,989 | ‐10,134 | ‐16,972 | ‐16,276 | ‐14,505 | ‐13,015 | ‐11,510 | ‐9,308 | ‐8,809 | ‐8,268 | ‐8,949 | |
| International | 350 | ‐4,060 | ‐16,049 | ‐27,852 | ‐27,995 | ‐29,378 | ‐30,130 | ‐29,369 | ‐25,813 | ‐24,989 | ‐22,717 | ‐24,387 | 1,294 | ‐2,590 | ‐15,242 | ‐26,859 | ‐26,894 | ‐28,240 | ‐28,968 | ‐28,164 | ‐24,869 | ‐24,297 | ‐22,033 | ‐23,277 | |
| Total | ‐72 | ‐8,119 | ‐26,838 | ‐45,392 | ‐44,956 | ‐44,701 | ‐44,102 | ‐41,495 | ‐35,903 | ‐34,373 | ‐31,421 | ‐34,013 | 1,566 | ‐5,579 | ‐25,376 | ‐43,831 | ‐43,170 | ‐42,746 | ‐41,983 | ‐39,674 | ‐34,178 | ‐33,106 | ‐30,302 | ‐32,226 | |
Appendix D: Summary of Analysis by Other Organizations
ACI: Airport would lose USD 111.8 billion gross revenues in 2020
|
Region |
Passenger number ‐ both interntional and domestic for full year 2020 |
Airport revenue ‐ both aeronautical and non‐ aeronautical for full year 2020 |
||
|
million and % change from 2020 "business as usual" baseline scenario |
USD billion and % change from 2020 "business as usual" baseline scenario |
|||
|
Africa |
‐169 |
‐69.5% |
‐2.970 |
‐69.1% |
|
Asia/Pacific |
‐2,049 |
‐59.2% |
‐29.600 |
‐59.3% |
|
Europe |
‐1,762 |
‐70.8% |
‐40.800 |
‐68.8% |
|
Latin America/Caribbean |
‐431 |
‐61.8% |
‐6.600 |
‐62.9% |
|
Middle East |
‐268 |
‐70.6% |
‐9.700 |
‐73.5% |
|
North America |
‐1,331 |
‐63.6% |
‐22.100 |
‐63.7% |
|
Total |
‐6,011 |
‐64.2% |
‐111.770 |
‐65.0% |
IATA: Airlines would lose USD 118.5 billion net profits in 2020
IATA’s estimates are based on “region of airline registration” while ICAO uses “all traffic from States in each region” for the regional break-down.
IATA recently updated its estimated loss of gross passenger revenues from USD 371 billion to USD 421 billion (USD 510 billion including passengers, cargo and others) but no regional break-down was released.
|
Region of airline registration |
Revenue Passenger Kilometres (RPKs) ‐ both interntional and domestic for full year 2020 |
Net profit |
|
year‐on‐year % change from 2019 level |
USD billion |
|
|
Africa |
‐72.0% |
‐2.0 |
|
Asia/Pacific |
‐62.0% |
‐31.7 |
|
Europe |
‐70.0% |
‐26.9 |
|
Latin America/Caribbean |
‐64.0% |
‐5.0 |
|
Middle East |
‐73.0% |
‐7.1 |
|
North America |
‐66.0% |
‐45.8 |
|
Total |
‐66.3% |
‐118.5 |
EUOCONTROL: A loss of € 140 billion for airlines, airports and ANSPs in Europe in 2020
The total number of flights expected in Europe is anticipated to be 55% lower than in 2019, a drop of 6 million fewer flights.
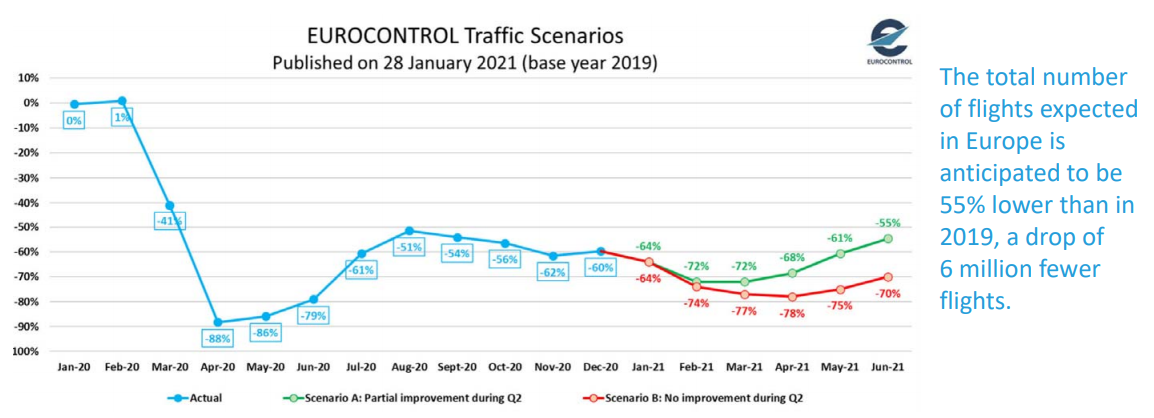
AFRAA: African Airlines would lose USD 8.56 billion passenger revenues in 2020
AFRAA’s estimates (USD 8.56 billion loss) is greater than IATA’s estimates (USD 6 billion loss). Both estimates are for airlines registered in Africa.
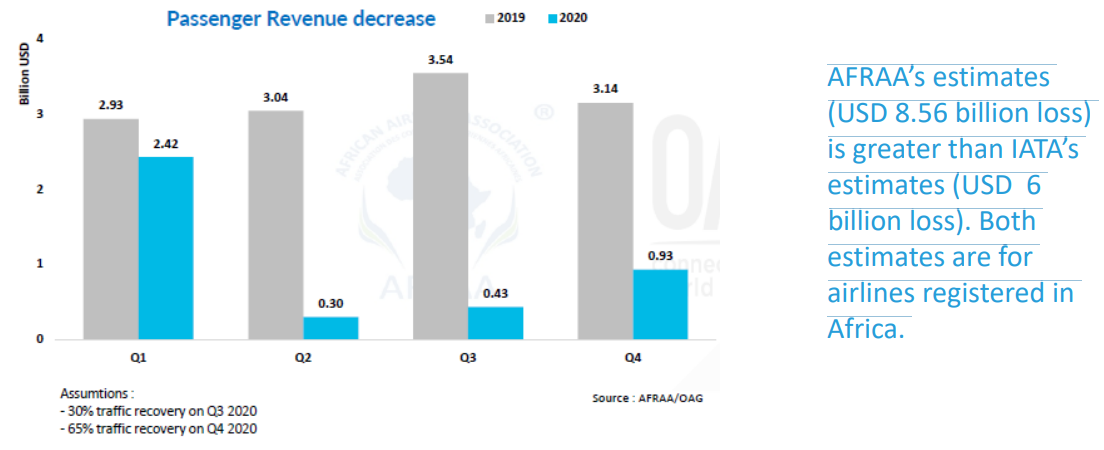
AACO: 57% decline of Arab Airlines’ passenger traffic in 2020
Total year’s decline in RPKs and ASKs for AACO members is forecasted to reach 57.1% and 34.0%, respectively, in 2020 compared to 2019.
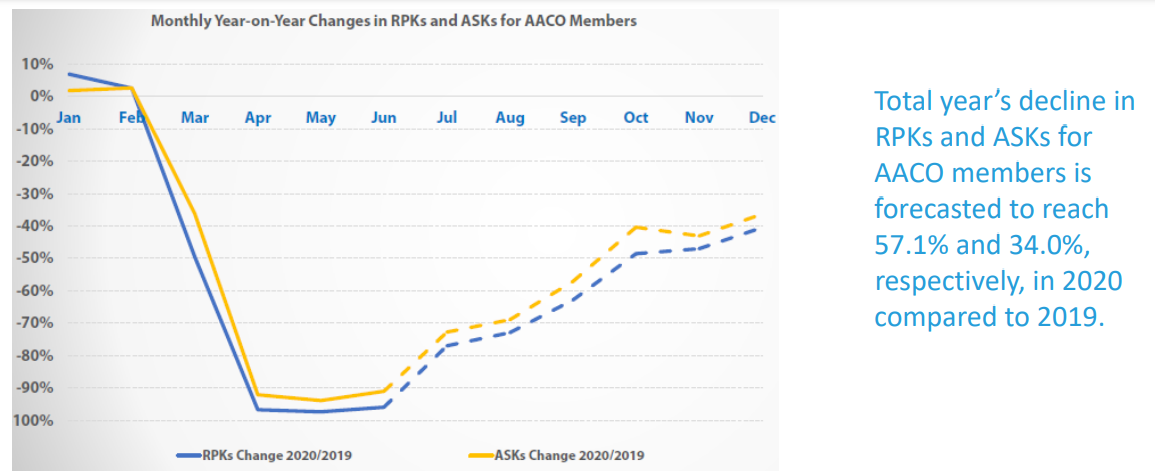
UNWTO: A loss of USD 910 to 1,170 billion in international tourism receipts in 2020
Total year’s decline in RPKs and ASKs for AACO members is forecasted to reach 57.1% and 34.0%, respectively, in 2020 compared to 2019.
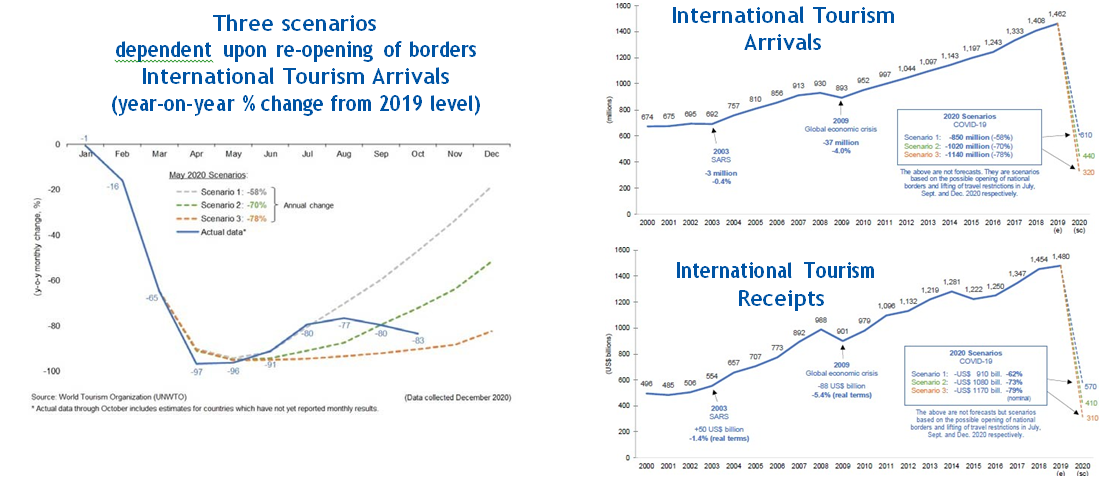
UNCTAD: USD 1.2 to 3.3 trillion global GDP loss in 2020 due to the break in international tourism
Loss of 1.5%, 2.8% and 4.2% of world’s GDP, respectively
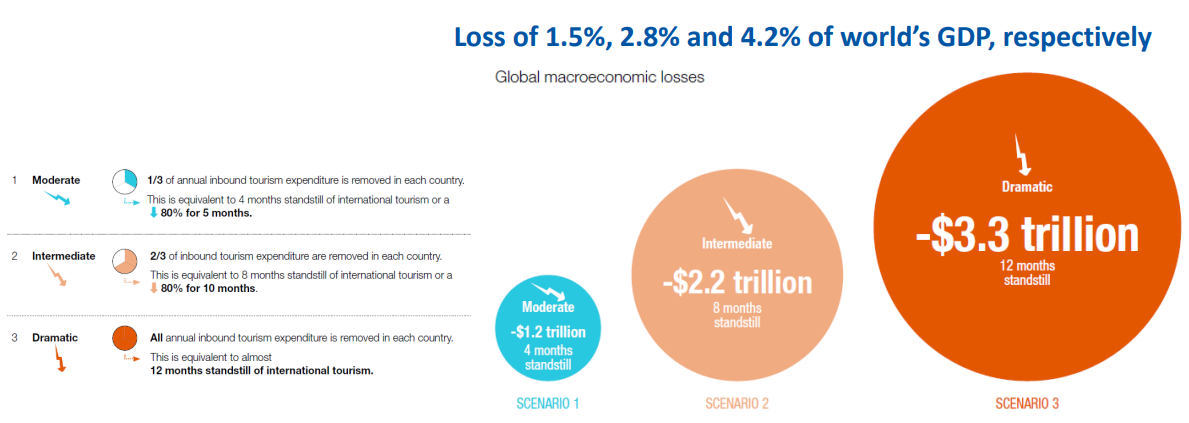
WTTC: A loss of 197 million jobs in travel and tourism sector in 2020
2020 forecasts – COVID‐19 impact on travel and tourism sector
|
Region |
Total Job Loss (million) |
Total GDP Loss (USD billion*) |
||||
|
Best‐Case |
Baseline |
Worst‐Case |
Best‐Case |
Baseline |
Worst‐Case |
|
|
Africa |
‐7.6 |
‐10.9 |
‐17.4 |
‐53 |
‐75 |
‐120 |
|
Asia/Pacific |
‐59.7 |
‐69.3 |
‐115.0 |
‐980 |
‐1,137 |
‐1,888 |
|
Europe |
‐14.2 |
‐18.4 |
‐29.5 |
‐771 |
‐1,000 |
‐1,608 |
|
Latin America/Caribbean |
‐5.9 |
‐7.7 |
‐12.4 |
‐111 |
‐143 |
‐229 |
|
Middle East |
‐2.7 |
‐3.4 |
‐4.9 |
‐99 |
‐125 |
‐179 |
|
North America |
‐8.1 |
‐11.4 |
‐18.2 |
‐673 |
‐955 |
‐1,520 |
|
Total |
‐98.2 |
‐121.1 |
‐197.5 |
‐2,686 |
‐3,435 |
‐5,543 |
|
Worst‐case scenario: Current restrictions starting to ease from September for short‐haul and regional travel, from October for mid‐haul and from November for long‐haul. Baseline scenario: Current restrictions starting to ease from June for regional travel, July for short‐haul or regional travel; from August for mid‐ haul, and from September for long‐haul. Best‐case scenario: Current measures starting to ease from June for short‐haul and regional travel; from July for mid‐ haul and from August for long‐haul. * based on 2019 prices and exchange rates. |
||||||
WTO: Global trade falling by 9.2% in 2020
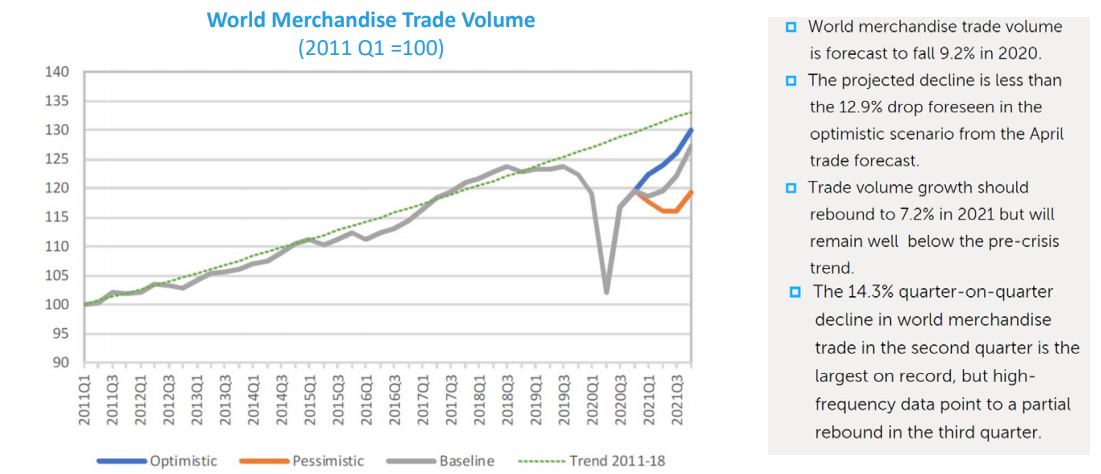
IMF & World Bank: Global economy is projected to contract by ‐3.5% to ‐4.3% in 2020
The Projections assume that the pandemic fades in the second half of 2020 and containment efforts can be gradually unwound
|
Real GDP (Percent change from previous year) |
IMF |
World Bank |
||||
|
2019 |
2020 |
2021 |
2019 |
2020 |
2021 |
|
|
World |
2.8 |
‐3.5 |
5.5 |
2.3 |
‐4.3 |
4.0 |
|
Advanced economies |
1.6 |
‐4.9 |
4.3 |
1.6 |
‐5.4 |
3.3 |
|
United States |
2.2 |
‐3.4 |
5.1 |
2.2 |
‐3.6 |
3.5 |
|
Euro Area |
1.3 |
‐7.2 |
4.2 |
1.3 |
‐7.4 |
3.6 |
|
Japan |
0.3 |
‐5.1 |
3.1 |
0.3 |
‐5.3 |
2.5 |
|
Emerging market and developing economies |
3.6 |
‐2.4 |
6.3 |
3.6 |
‐2.6 |
5.0 |
|
Emerging and Developing Asia |
5.4 |
‐1.1 |
8.3 |
|
|
|
|
East Asia and Pacific |
|
|
|
5.8 |
0.9 |
7.4 |
|
China |
6.0 |
2.3 |
8.1 |
6.1 |
2.0 |
7.9 |
|
South Asia |
|
|
|
4.4 |
‐6.7 |
3.3 |
|
India |
4.2 |
‐8.0 |
11.5 |
4.2 |
‐9.6 |
5.4 |
|
Emerging and Developing Europe |
2.2 |
‐2.8 |
4.0 |
|
|
|
|
Europe and Central Asia |
|
|
|
2.3 |
‐2.9 |
3.3 |
|
Russia |
1.3 |
‐3.6 |
3.0 |
1.3 |
‐4.0 |
2.6 |
|
Real GDP (Percent change from previous year) |
IMF |
World Bank |
||||
|
2019 |
2020 |
2021 |
2019 |
2020 |
2021 |
|
|
Emerging market and developing economies |
|
|
|
|
|
|
|
Middle East and Central Asia |
1.4 |
‐3.2 |
3.0 |
|
|
|
|
Middle East and North Africa |
|
|
|
0.1 |
‐5.0 |
2.1 |
|
Saudi Arabia |
0.3 |
‐3.9 |
2.6 |
0.3 |
‐5.4 |
2.0 |
|
Sub‐Saharan Africa |
3.2 |
‐2.6 |
3.2 |
2.4 |
‐3.7 |
2.7 |
|
Nigeria |
2.2 |
‐3.2 |
1.5 |
2.2 |
‐4.1 |
1.1 |
|
South Africa |
0.2 |
‐7.5 |
2.8 |
0.2 |
‐7.8 |
3.3 |
|
Latin America and the Caribbean |
0.2 |
‐7.4 |
4.1 |
1.0 |
‐6.9 |
3.7 |
|
Brazil |
1.4 |
‐4.5 |
3.6 |
1.4 |
‐4.5 |
3.0 |
|
Mexico |
‐0.1 |
‐8.5 |
4.3 |
‐0.1 |
‐9.0 |
3.7 |
|
High‐income countries |
|
|
|
1.6 |
‐5.4 |
3.2 |
|
Developing countries |
|
|
|
3.7 |
‐2.3 |
5.2 |
|
Low‐income countries |
5.3 |
‐0.8 |
5.1 |
4.0 |
‐0.9 |
3.3 |
* IMF and World Bank use different Region/State classification; 2020 estimates; and 2021 projections
OECD: Sharp decrease in consumers’ expenditures for air travel due to containment measures